


Introduction
Obesity is a worldwide health problem, and its global prevalence has increased dramatically over the past three decades. Obese children are far more likely than normal weight children to develop dyslipidemia, elevated blood pressure, and insulin resistance, which significantly increase their risk of cardiovascular and metabolic diseases [1]. Several hormonal changes are reported in obesity. Some of these changes are considered secondary effects of obesity and are usually restored after weight loss [2-8]. In recent years, there has been increasing attention on thyroid function in patients with obesity. Several studies have reported moderately elevated thyrotropin (TSH) and normal or slightly elevated free triiodothyronine (fT3) levels in obese subjects [3-8]. Positive correlations were found between actual serum TSH levels and weight gain [8]. The mechanisms leading to increased TSH and fT3 levels in patients with obesity are still unclear.
No nationwide study evaluating the relationship between thyroid function and obesity in children has yet been conducted in Korea. We aimed to evaluate the association between thyroid function and obesity in Korean children using data obtained from the Korean National Health and Nutrition Examination Survey (KNHANES) conducted from 2013 to 2015.
Materials and methods
1. Subjects
We used data from the KNHANES VI (2013–2015). The target population of KNHANES comprises noninstitutionalized Korean citizens residing in Korea. The sampling plan follows a multistage-clustered probability design [9]. This cross-sectional and nationally representative survey was conducted by the Korea Centers for Disease Control and Prevention (KCDC).
Blood samples were collected from children aged ≥10 years. From 2013 to 2015, a survey was conducted annually that included 2,425 children and adolescents aged 10–18 years. We excluded individuals for whom data on TSH levels were missing (n=1,404), as well as patients who had not fasted for at least 8 hours prior to blood sampling (n=19). Twenty-seven adolescents who had increased levels of thyroid peroxidase autoantibodies (TPO Ab>34.0 IU/mL) were also excluded. Ultimately, the study population consisted of 975 children and adolescents (516 boys and 459 girls). The KNHANES has been reviewed and approved by the KCDC annually (2013-07CON-03-4C, 2013-12EXP-03-5C, 2015-01-02-6C). This study was approved by the Institutional Review Board of Inha University Hospital (INHAUH 2017-10-017).
2. Anthropometric and biochemical measurements
Waist circumference (WC) was measured to the nearest 0.1 cm at the midpoint between the bottom of the rib cage and the top of the iliac crest, with the subject standing. Systolic blood pressure (SBP) and diastolic blood pressure (DBP) were measured three times while the subjects were seated, and the two last measurements were averaged for the analysis.
Blood samples were obtained after an 8-hour overnight fast for analysis of lipid profile, namely, triglycerides (TG), total cholesterol, and high-density lipoprotein (HDL) cholesterol. TSH, fT3, and free thyroxine (fT4) levels were measured by electrochemiluminescence immunoassays (Roche Diagnostics, Mannheim, Germany). The normal values range between 0.35 and 5.50 mIU/L for TSH, and between 0.89 and 1.76 ng/mL for fT4.
3. Definition
Obesity and overweight were defined according to the body mass index (BMI)≥85th percentile and ≥95th percentile, respectively [10]. Obesity degree was evaluated using the BMI z-scores, calculated with the LMS method [11]. We categorized the subjects with BMI≥85th percentile into the overweight and the remaining subjects into the nonobese group, and the cut-off value was based on the 2007 Korean National Growth Charts [12].
A determination of abdominal obesity in adolescents was based on the metabolic syndrome definition of the International Diabetes Federation [13]. Abdominal obesity was defined as WC≥90th percentile for age and gender based on 2007 Korea Growth Charts for children aged 10–16 years, and ≥90 cm for men and ≥80 cm for women as the ethnic-specific values for adolescents aged ≥16 years [12,14].
4. Statistical analysis
Data were analyzed with the IBM SPSS ver. 18.0 (IBM Co., Armonk, NY, USA). The Complex Samples Plan, which is available as the complex samples option in later SPSS versions, was used for all analyses to account for sample weighting. All values were presented as means±standard deviation. A P-value of <0.05 was considered significant. The association between thyroid function and obesity was identified using simple and multiple linear regression analyses for the complex survey.
Results
1. Baseline characteristics of the study population
The anthropometric and laboratory characteristics of the study participants are shown in Table 1. Among the subjects, 22.4% were in the overweight. The average age and the proportion of sex (female) were 14.3±0.2 years and 48.2% in the overweight and 14.2±0.1 years and 46.3% in the nonobese group, respectively. The average WC and BMI z-scores values were 83.5±0.7 cm, and 1.7±0.0 in the overweight and 67.7±0.3 cm, and -0.2±0.0 in the nonobese group, respectively. SBP was higher in the overweight (113.8±0.7 mmHg) than that in the nonobese group (107.4±0.4 mmHg), but DBP values in these groups were similar in both groups (67.2±0.6 mmHg and 65.9±0.4 mmHg).
Average TG levels were seemed higher in the overweight (98.0±5.1 mg/dL) than that in the nonobese group (78.4±1.7 mg/dL), while HDL cholesterol levels were seemed lower in the overweight (48.3±0.8 mg/dL) than that in the nonobese group (53.0±0.4 mg/dL).
Average TSH levels were 3.1±0.2 μIU/mL in the overweight and 2.7±0.1 μIU/mL in the nonobese group. Average fT4 levels were 1.2±0.0 ng/dL in the overweight and 1.3±0.0 ng/dL in the nonobese group. Among overweight subjects, 49.1% (107 of 218) had WC beyond the 90th percentile. Additionally, 8.3% (18 of 218) of the overweight and 5.8% (44 of 757) of the nonobese group subjects had TSH levels >5.5 μIU/mL.
2. Distribution of thyroid function in the study population
The prevalence of subclinical hypothyroidism (SH) was 6.6% (67 of 1,021). The prevalence of TPO Ab in patients with SH was 0.3% (3 of 1,021). Subjects with SH consisted of 48 normal weight and 19 obese subjects. The prevalence of total subclinical hyperthyroidism and overt hyperthyroidism was 0.3% (3 of 1,021) and 0.8% (8 of 1,021), respectively. The prevalence of TPO Ab in patients with overt hyperthyroidism was 0.3% (3 of 1,021).
3. Association between obesity indexes and thyroid function
We assessed the relationship between TSH level and BMI and WC after dividing the group into 2 according to the TSH level (Table 2). Of the subjects, 11.6% (113 of 974) were included in the abdominal obesity group, and 22.4% (218 of 975) were included in the overweight based on BMI. Further, 10.6% (12 of 113) of abdominal obesity group subjects (WC≥90th percentile) had TSH levels >5.5 μIU/mL. There was a positive correlation between abdominal obesity and TSH levels (P=0.026), but no significant correlation was observed between overweight and TSH levels (P=0.081).
4. Association of obesity and metabolic syndrome-related factors with TSH levels
We assessed the association between TSH levels and metabolic syndrome-related factors, overweight, and WC (Table 3A, B). Because a distribution of TSH values was skewed, we transformed the data into a log-scale, adjusted for age and gender. There was a significant association between log(TSH), WC, and TG levels in the univariable model. Overweight and WC were analyzed separately using multivariable model. In the multivariable model that analyzed log(TSH) and overweight together, overweight were not significantly associated with TSH levels whereas HDL cholesterol and TG levels showed a significant association with TSH levels. In the multivariable model that analyzed lnTSH and WC, WC, HDL cholesterol levels, and TG levels were all significantly associated. Log(TSH) was higher in the WC≥90th percentile group than that in the WC<90th percentile group by 0.177.
5. Association of obesity and metabolic syndrome-related factors with fT4 levels
We assessed the association between obesity and metabolic syndrome-related factors including fT4 levels, overweight, and WC (Table 4A, B). In the univariable model of fT4 levels, overweight and WC were significantly associated. In the multivariable model of fT4 levels and overweight, only overweight were significantly associated. The BMI≥85th percentile group had lower fT4 levels than the BMI<85th percentile group by 0.057. In the multivariable model of fT4 levels and WC, WC and TG were significantly associated. The WC≥90th percentile group had lower fT4 levels than the WC<90th percentile group by 0.046.
Discussion
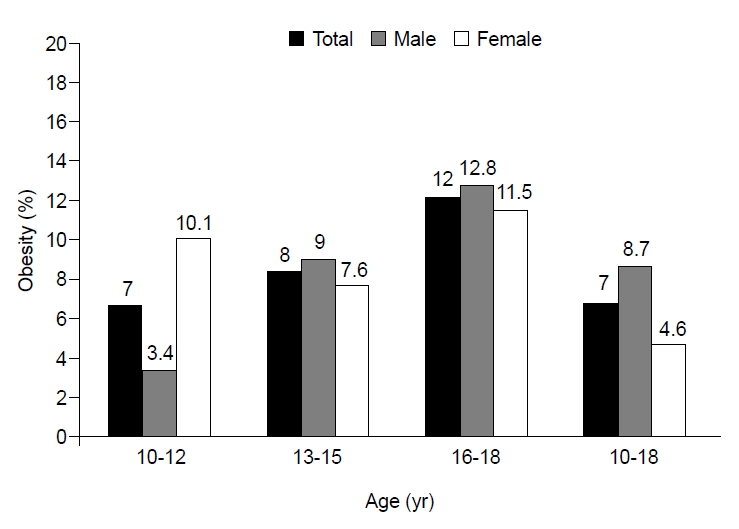
Metabolic syndrome in obese children is positively correlated with the level of obesity [15]. Among Korean children, the prevalence of obesity has been higher in males than in females since 1997. The prevalence of metabolic syndrome as well has been higher in males than in females since 2001 [6,16]. In this study, the prevalence of childhood obesity (BMI≥95th percentile) was 8.7% (45 of 516) in males and 4.6% (21 of 459) in females (Fig. 1). The prevalence of overweight phenotype (BMI≥85th percentile) in children was 22.7% (104 of 459) in girls and 22.1% (114 of 516) in boys, and the prevalence of abdominal obesity was 12.7% (58 of 458) in girls and 10.7% (55 of 516) in boys.
Many recent cross-sectional studies reported on the association between thyroid hormones and obesity. In most studies, serum TSH levels were higher in obese children than in normal weight children [3-8,17], and fT4 levels were similar between the two groups [3-5,17]. In our study, there was no significant relationship between the TSH level and the obesity group, and the TSH level and the overweight group (P=0.075, P=0.218). Serum TSH and fT3 levels were positively correlated with BMI z-score [5,6]. It is estimated that the TSH concentrations may be higher in the obesity group than in the overweight group. A few longitudinal studies reported TSH levels to be higher in obese children than that in normal weight children and these levels normalized after weight loss. Reinehr et al. [4] compared obese children and children with anorexia nervosa (AN). Baseline TSH levels were high in obese children and low in children with AN. While serum TSH levels in obese children decreased with weight loss, TSH levels in children with AN increased with weight gain.
TSH levels reversibly change according to changes in weight. High levels of TSH in obese children are thought to be owing to obesity, and T3 levels are often already elevated. Therefore, initial treatment of obese children with SH should include lifestyle intervention rather than thyroid hormone replacement therapy [3,5,6].
Although the mechanisms of changes in thyroid hormone levels in obese children are still unclear, there are a few hypotheses stating that leptin is likely responsible for controlling hypothalamic production of TSH. Leptin, a hormone secreted by adipose tissues, is involved in the control of food intake, regulation of energy expenditure, and homeostasis of body weight [18]. Leptin levels are higher in obese children than in normal weight children [4]. It is supposed, since leptin is involved in the hypothalamic production of TSH, serum TSH and leptin levels in obese females are estimated to decrease simultaneously after weight loss [19]. Also, there is a hypothesis that the increase of the TSH and T3 levels in obesity is an adaptation process. Resting energy expenditure is positively correlated with serum fT3 levels. It is an adaptation process to increase calorie consumption in order to prevent extra weight gain in obesity children. On the other hand, when losing weight, the fT3 levels decrease. This makes it difficult to add additional weight loss. But, the exact mechanism is not fully understood [6].
Subjects with hypothyroidism have higher prevalences of dyslipidemia, hypertension, atherosclerosis, and coronary heart disease than individuals with euthyroidism, but the association is still unclear. The prevalence of metabolic syndrome was higher than the low TSH group in the high TSH group [20,21]. Mamtani et al. [22] reported that among metabolic syndrome-related factors, WC, BMI, and abdominal obesity were significantly associated with thyroid function. In this study, we showed that abdominal obesity represented by WC was more related to serum TSH levels than obesity represented by BMI z-scores. Deviating from previous studies [3-8], on the result of this study that there was no clear association observed between BMI and TSH levels is likely due to the smaller proportion of obese children in this sample. Among the entire study subjects (n=975), only 218 and 51 children were overweight and obese, respectively.
Shalitin et al. [17] assessed anthropometric and laboratory variables after putting the obese children into 12-week weight reduction programs. In the group that had reduced BMI z-scores after the intervention, analysis of anthropometric and laboratory variables showed an association between TSH levels and WC, but not between TSH levels and BMI z-scores, compared to the group that did not exhibit reduced BMI z-scores. There are several studies that assess the association between TSH levels and obesity. To date, the relationship has not been clearly defined.
There are 3 major limitations of this study. First, the cross-sectional characteristic of this study allows us to assess the association between thyroid hormones and abdominal obesity, but the causal relationship could not be identified. Second, Thyroid hormone related data included only TPO Ab, TSH, and fT4. There was a limit to data presentation compared to previous studies. Third, because we only had partial data on fasting insulin levels, which are associated with the metabolic syndrome, we could not assess the association between insulin resistance and TSH levels.
Despite these limitations, unlike previous studies from Korea, this study included a large survey of Korean children with normal weight. The KNHANES collects representative data for the nation, and therefore we could predict the prevalence of obesity and SH in Korean children. Therefore, this is the first study in Korea to assess the relationship between abdominal obesity and TSH levels in children. In this study, the association was clearer between TSH levels and abdominal obesity than between TSH levels and obesity. In addition, serum TSH levels were correlated with metabolic syndrome-related factors such as HDL cholesterol and TG levels. In conclusion, children with abdominal obesity tend to reveal thyroid dysfunction. Therefore, when children are diagnosed with abdominal obesity, they may consider thyroid function test as well as the metabolic syndrome-related factors.
Further studies are needed to clarify the mechanisms and assess the association between lipid and TSH levels in children.