


Highlights
┬Ę Pediatric patients with chronic disease treated with glucocorticoid may have skeletal fragility.
┬Ę The higher accumulated dose and duration of glucocorticoid are risk factors for a lower bone mass.
┬Ę It is important to monitor glucocorticoid dose and evaluate of bone mineral density.
Introduction
Children and adolescents with adequate bone mass accrual follow linear growth and have a low risk of bone fracture [1]. However, different from healthy children, pediatric patients with chronic underlying diseases may show growth retardation, including skeletal morbidity such as osteoporosis. In particular, in acute leukemia, the disease-associated factors themselves cause low bone mass, which is sometimes diagnosed as fracture induced by a decrease in bone mineral density (BMD) due to infiltration of leukemic cells in the bone [2]. With the exception of primary osteoporosis such as osteogenesis imperfecta, secondary osteoporosis, or low bone mass, is associated with long-term immunosuppressive drugs or organ transplantation. In addition, inflammatory cytokines associated with rheumatoid and inflammatory bowel diseases reduce bone production, increase resorption, and eventually impair bone health [3].
There are various methods for assessing pediatric BMD. The most traditional tool for measurement, dual-energy x-ray absorptiometry (DXA), provides low ionizing radiation and is useful for evaluation, and pediatric reference data using this technique are well organized [4]. Three-dimensional densitometry methods, such as quantitative computed tomography (QCT), peripheral QCT, and high-resolution QCT, can distinguish trabecular from cortical segments and provide geometric and microarchitectural information to measure bone strength [5].
According to the guidelines of the International Society of Clinical Densitometry [6], osteoporosis is defined as one or more vertebral compressions or crush fractures in the absence of local disease or high-energy trauma. If vertebral compression, fractures are absent, diagnosis of osteoporosis is established by the presence of both a clinically significant fracture history and a bone densitometry (BMD) z-score below -2.0. There should be at least one clinically significant fracture history of 2 or more long bone fractures by the age of 10 years and 3 or more long bone fractures by the age of 19 years. However, low BMD differs by country or ethnicity in children and adolescents; it is defined as z-score Ōēż-2.0 to reference values by gender and age. However, we should remember that fractures can occur even if the z-score is not low [7].
By applying these criteria, many studies have reported on the risk factors for decreased bone density in children with a range of chronic diseases. Grover and Bachrach reviewed numerous chronic conditions related to low bone mass and fragility fractures including chronic inflammatory status, endocrine disturbance, and drug administration such as glucocorticoids [8]. Nobile et al. reported that nasogastric tube feeding and low physical activity were associated with lower BMD [9]. However, clear guidelines have not yet been established for implementing countermeasures against BMD risk factors.
This study aimed to investigate the clinical factors associated with BMD among children and adolescents with osteoporosis secondary to treatment for underlying clinical conditions. This analysis was performed to determine which factors related to bone condition were able to prevent skeletal morbidity and foster bone health in pediatric patients with underlying diseases.
Materials and methods
1. Subjects
The subjects of this study were children and adolescents aged 10ŌĆō18 years who had evaluated lumbar spine BMD (LSBMD) after treatment for underlying diseases, including hemato-oncologic, rheumatologic system, and inflammatory bowel diseases. After treatment of the underlying disease in this hospital, patients from the relevant department and the pediatric endocrine department were selected. From March 2019 to March 2021, a total of 202 patients underwent bone density tests and was evaluated for LSBMD. Finally, 117 patients aged 10 to 18 years whose standard score for bone density in children and adolescents in Korea was within specified parameters were selected; 85 patients under the age of 10 and over the age of 18 were excluded. We retrospectively reviewed the medical records of the 117 selected patients who underwent the first DXA after treatment and 43 of 117 children who underwent follow-up DXA. According to domestic insurance standards, if the z-score is less than -2.0, follow-up BMD is conducted after 6 months within the first year. Further BMD tests are conducted once a year. If the z-score is between -1.0 and -2.0, follow-up BMD is conducted once a year. This hospital follows the same criteria. After one year, 43 of 49 patients under z-score -1.0 (Table 1) were examined in follow-up BMD from the initial test because of outpatient or personal schedules.
2. LSBMD and vertebral fracture
LSBMD was assessed using DXA (Horizon W DXA system, Hologic Inc., Marlborough, MA, USA) from the first to fourth lumbar vertebrae. BMD (g/cm2) was calculated according to the national standard reference values [10] and converted to z-scores. All BMDs were measured by a pediatric radiologist without any information about the patient's medical history. The presence of vertebral fracture (VF) was determined in the dorsal and lumbar spine examined simultaneously with DXA. VF was evaluated by at least 2 pediatric endocrinologists using a modified Genant semiquantitative technique [11]. VF was divided into grades 1ŌĆō3 in the technique, but only the presence or absence of fracture was included in this study. According to International Society for Clinical Densitometry guidelines, both clinically significant fracture findings and BMD z-scores below -2.0 are defined as osteoporosis. Because VF may occur without trauma even when the BMD z-score is not low, patients with only VF were also regarded as having osteoporosis in this study.
3. Data collection
The anthropometric data of this study were converted to standard deviation scores (SDSs) in accordance with the 2017 Korean National Growth Chart. Height was measured using a Harpenden Stadiometer (Holtain Ltd., Wales, UK), and weight was measured using a CAS scale (CAS, Seoul, Korea). Height, weight, and body mass index (BMI) were calculated using an SDS based on the Korean National Growth Chart Reference published in 2017.
Serum calcium (absorbance assay, Roche, Basel, Switzerland), phosphorus (molybdate UV, Rapikit, Chandigarh, India), 25-hydroxycholecalciferol vitamin D total level (chemiluminescence immunoassay, DiaSorin, Saluggia, Italy), intact parathyroid hormone (immunoradiometric assay, DiaSorin, Saluggia, Italy), and alkaline phosphatase (colorimetric assay according to the International Federation of Clinical Chemists, Roche, Basel, Switzerland) were measured when the initial DXA scans of all patients were performed. Because the subjects were chronically ill with different conditions and onset dates, the scope of steroid administration was limited. In 2 previous studies, the frequency of VF reached its peak between 6 months and 1 year after steroid treatment began [12,13]. In addition, the frequency of VF continued to decrease after 24 months, and 80%ŌĆō90% of osteoporotic events occurred within 2 years from the starting point of GC. LSBMD z-score showed the largest decrease at 6 months and recovered thereafter. There was no statistical difference from baseline to 2 years after GC treatment [12]. Based on this, the dose of GCs taken within the last 2 years from the initial evaluation of LSBMD was calculated. According to the standardized GC equivalencies [14], prednisolone was unified, calculated, and finally converted by dividing by body surface area.
4. Statistical analyses
All values are expressed as median (interquartile range [IQR]) or presented as number (percentages). The Kruskal-Wallis test was used to compare continuous variables. Bonferroni correction was performed for post hoc analysis. Linear and nonlinear regression analyses were performed to identify the association between initial LSBMD and GC dosage or duration. Odds ratios (ORs) were estimated by analyzing the logistic regression models. The adjusted OR was estimated using univariate and multivariate logistic regression models. A receiver operating characteristic (ROC) curve was used to set the optimal cutoff point of the initial LSBMD z-score, which could predict the possibility of osteoporosis. Statistical analyses were performed using IBM SPSS Statistics ver. 24.0 (IBM Co., Armonk, NY, USA) and GraphPad Prism 8 (GraphPad Software, La Jolla, CA, USA). P<0.05 was considered statistically significant.
Results
1. Demographics and clinical features
The baseline demographics and clinical features of the study subjects are summarized in Table 1. The total group comprised 117 adolescents, including 64 men (54.7%). The median age of all enrolled subjects diagnosed with underlying disease was 11 years (IQR, 6ŌĆō13 years). The majority of subjects had underlying hemato-oncologic diseases (92 of 117, 78.6%), especially acute leukemia (67 of 92, 72.8%). Approximately half of the subjects received GC treatment for underlying disease (58 of 117, 49.6%). The median age at which subjects underwent initial DXA was 15 years (IQR, 13ŌĆō16 years). The median z-score of initial LSBMD was -1.1 (IQR, -1.9 to -0.5). Among all patients, 19 (16.2%) had a z-score of LSBMD below -2.0, and VF was found in 36 (30.8%) at initial DXA. Follow-up DXA was performed in 43 patients (36.8%). The median age of patients who underwent follow-up DXA was 16 years (IQR, 14ŌĆō18 years). The median z-score of follow-up LSBMD was -1.0 (IQR, -1.7 to -0.2). Among all patients, 12 (27.9%) had a z-score of LSBMD below -2.0, and VF was found in 13 patients (30.2%).
2. Clinical parameters associated with initial LSBMD
We divided the initial z-scores of LSBMD into 3 groups [15] : z-score below -2, between -2 and -1, and over -1. The association of various clinical parameters between these groups is summarized in Table 2. Comparison of previous anthropometric data measured at diagnosis of underlying disease revealed significant differences in both weight and BMI, but not in height among the 3 groups (P=0.004 in weight, P=0.003 in BMI, P=0.180 in height). Post hoc analysis revealed statistical differences in weight and BMI between groups with z-scores below -2 and over -1 (P=0.009 in weight and P=0.006 in BMI with Bonferroni correction; data not shown). There were also significant differences in height, weight, and BMI at the time of initial BMD examination (P=0.003 for height, P=0.001 for weight, P=0.015 for BMI). In post hoc analysis, weight was exclusively statistically different between the 2 groups: (1) between subjects with z-scores below -2 and between -2 and -1 (P=0.033 with Bonferroni correction; data not shown) and (2) between subjects with z-scores below -2 and over -1 (P=0.027 with Bonferroni correction; data not shown). There was no significant association between the z-score and bone metabolic markers such as serum calcium, phosphorus, parathyroid hormone, and 25-hydroxycholecalciferol vitamin D total level. In addition, stem cell transplantation was not statistically associated with VF and LSBMD z-score (P=0.496 with the chi-square test, P=0.889 with Mann-Whitney U-test; data not shown). Neither LSBMD z-score nor VF were statistically significantly affected with or without radiotherapy (P=0.141 with Mann-Whitney U-test, and P=0.586 with the chi-square test; data not shown). Among patients who received GC treatment within 2 years of the initial DXA examination, there was a significant difference in the median accumulated dose according to the range of z-scores (P=0.029). However, post hoc analysis did not find a statistical difference among the groups (data not shown). The duration and average dose of GC treatment were not significantly different among the 3 groups.
3. Association between GC and BMD
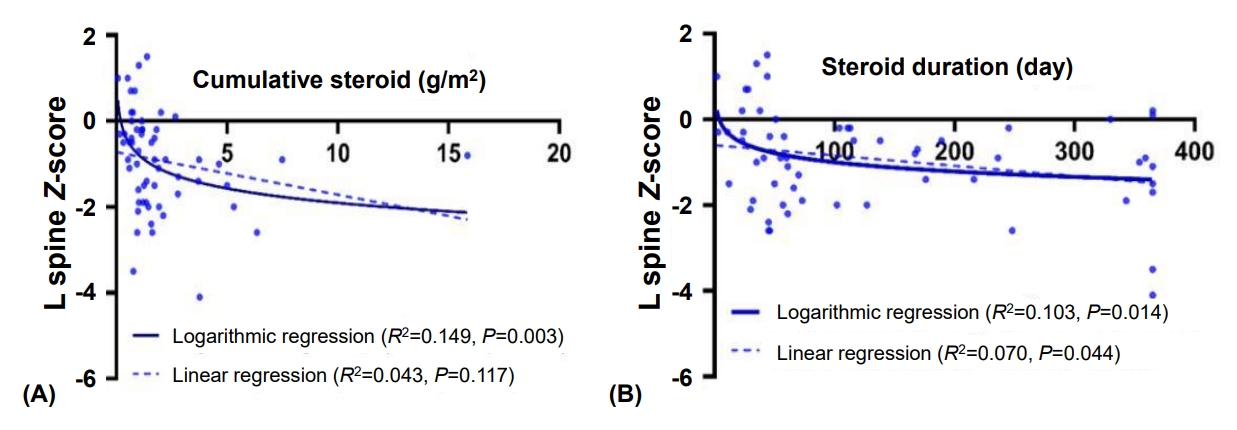
Considering that the cumulative dose of GC was increased in patients with z-scores below -2 (Table 1), we analyzed the effect of GCs on BMD. GC use itself did not significantly affect the initial z-scores of LSBMD (P=0.098 with Mann-Whitney U-test; data not shown). Thus, regression analyses were performed among patients who received GC therapy. The association between the cumulative dose of GC and initial z-scores of LSBMD was significant in logarithmic regression analysis (P=0.003, R2=0.149) (Fig. 1) but not in linear regression analysis (P=0.117, R2 =0.043) (Fig. 1). Statistical significance between duration of GC use and initial z-score of LSBMD was observed in both the linear and logarithmic regressions. Logarithmic regression analysis showed higher R2 values than linear regression analysis (P=0.044, R2 =0.070 in linear regression analysis; P=0.014, R2 =0.103 in logarithmic regression analysis, Fig. 1).
4. Risk factors of osteoporosis in the GC treatment group
Risk factors for osteoporosis in the GC treatment group using a multiple logistic regression model are summarized in Table 3. We adjusted each variable for sex and anthropometric data at diagnosis of the underlying disease. Height and weight at the time of initial BMD were not significantly associated with risk of osteoporosis (adjusted P=0.519 in height and adjusted P=0.237 in weight). The duration of steroid treatment was not a significant factor (adjusted P=0.081, with exponential log formation). The cumulative dose of GC was significantly associated with the risk of GC-induced osteoporosis when the exponential log function was applied (adjusted P=0.043). Bone metabolic markers, including serum calcium, phosphorus, and alkaline phosphatase, did not significantly influence the risk of GC-induced osteoporosis.
5. Risk factors of osteoporosis at follow-up LSBMD
The risk factors for osteoporosis were analyzed from the follow-up bone density results and are summarized in Table 4. We adjusted for sex, age, and anthropometric data at the initial LSBMD evaluation and cholecalciferol interventions. Contrary to the data shown in Table 3, neither accumulation dose nor duration of steroids was a risk factors for osteoporosis, even when converted to exponential log formation. However, when the initial LSBMD z-score was ŌłÆ2 or less, the OR of progression to osteoporosis was relatively high (adjusted OR, 31.1; adjusted P=0.006) (Table 4).
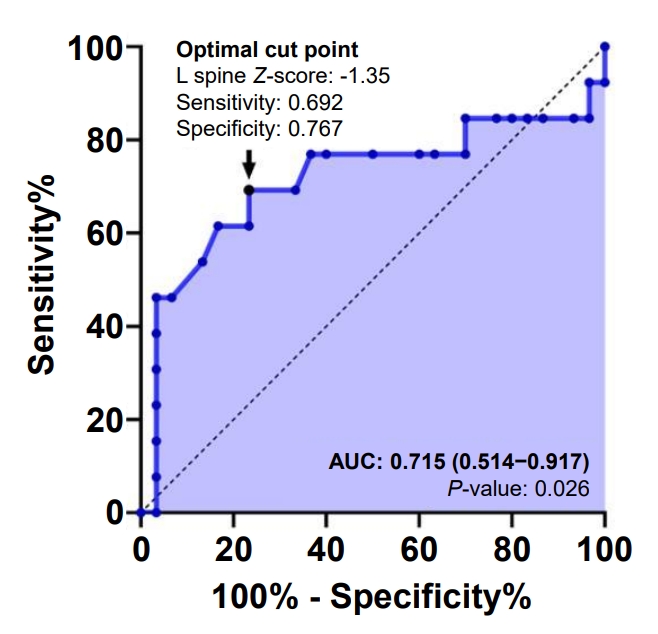
We also investigated whether further VF can be predicted through the initial LSBMD z-score value by ROC curve analysis. The area under the curve was 0.715 (95% confidence interval, 0.514ŌĆō0.917; P=0.026) (Fig. 2). The optimal cutoff point of the initial LSBMD z-score was 1.35 with 69.2% sensitivity and 76.7% specificity (calculated using the Youden index). Additionally, we found that the OR indicating progression to osteoporosis was high when the initial LSBMD z-score was below -1.35 (adjusted OR, 11.939; adjusted P=0.005).
Discussion
This study reaffirmed that GCs induced low bone density, which was consistent with the background of secondary osteo porosis in patients with chronic illness [16,17]. Although long-term use of GC is an inevitable treatment for chronic underlying diseases, the cornerstone drug has adverse effects including low LSBMD z-score and growth retardation [18]. Our results from this study confirm that sustained, regular evaluation of bone health is necessary for pediatric patients who have received long-term GC therapy.
A previous study showed that every 0.5-mg/kg increase in average daily dose of GC was associated with a 95% increased VF risk [12]. In another study, the average daily, cumulative dose and pulse therapy with GCs for leukemia had been demonstrated as strong correlating factors in spine fracture [8]. Conversely, a previous observation study reported that pediatric patients treated with varying GC regimens indicated a non-significant reduction in the z-score associated with GC. In most studies, daily prednisone therapy is performed in pediatric patients with chronic diseases and was associated with a decrease in spine z-score [19]. This study reconfirmed that a higher dose and longer treatment duration of GCs suggest lower bone mass. The difference between this and previous studies is that the present study revealed a logarithmic association between LSBMD and GCs. Since the correlation between dose or duration and BMD follows a logarithmic function, even a slight increase in dose or duration may have a negative effect on BMD if patients received steroid therapy.
We found a relatively optimal LSBMD z-score of -1.35, which implies a low bone mass (Fig. 2). This suggests that VF can be predicted on follow-up spine radiography when the initial LSBMD z-score is less than -1.35. Our study revealed that it is necessary to confirm follow-up BMD when the initial BMD z-score is lower than those of people of the same age, sex, and height. If the initial LSBMD z-score is as low as -2 or less, a VF could be predicted at follow-up examination. In addition, the lower is the initial LSBMD z-score, the higher is the OR value of osteoporosis at follow-up. The lower is the initial BMD, the higher is the aggravation rate of bone damage. In all cases, it is important to evaluate the initial BMD after treatment of the underlying disease.
A z-score below -2 is not the only absolute criterion for LSBMD of patients with GC-induced osteoporosis, even if there is no official definition of low bone mass in children and adolescents. In this study, we found a difference in both groups with z-scores between -1 and -2 and above -1 in terms of cumulative dose of GC and anthropometric data. In other words, standards are needed for children and adolescents with relatively low bone density. The standard of BMD is only for children over 10 years of age in Korea [20,21]; moreover, it is difficult to measure BMD in younger children. Although BMD itself has many limitations, it is the only evaluation tool currently used to assess bone health. The lumbar spine and total less head are internationally preferred sites for BMD evaluation [22], but the protocol was not prepared for total less head in children and adolescents in Korea [21].
The fundamental strategy to prevent secondary osteoporosis is to use fewer GCs, and calcium supplements, alfacalcidol, and cholecalciferol [23] are commonly used as adjunct treatments. A guideline describing the doses of calcium and vitamin D according to age for prevention of secondary osteoporosis in children and adolescents was recently published [24]. However, a previous randomized double-blind controlled trial showed that, if used in excess, alfacalcidol, an analogue of vitamin D, as prophylactic treatment was ineffective to improve LSBMD in patients with GC-induced osteopenia in juvenile rheumatic disease [25]. To date, bisphosphonates have been effective as a treatment for osteoporosis [26]. Bisphosphonates are medications derived from pyrophosphate and inhibit osteoclasts and ongoing bone remodeling [27]. The number of patients who received oral bisphosphonates in the study was significantly small (8 patients), possibly why we did not observe a significant correlation with bisphosphonates and z-score.
This study has some limitations due to its retrospective nature with patients undergoing BMD measurements within a specific period. Both the total number of patients included in the study and the number of patients tested for follow-up BMD were significantly small. In addition, the pathogenesis, clinical course, and treatment of each underlying disease of the included patients varied. Thus, the adverse effects of each treatment regimen might have caused different skeletal outcomes. When 3 different disease groups were compared, there was no significant difference in the z-score of DXA and VF by disease and post hoc analysis. Patients taking GCs comprised 45.7% of those with hemato-oncologic disease, 50% of those with gastrointestinal disease, and 76.9% of those with rheumatologic disease. There was no significant difference between the z-score of DXA and VFs when only the group of patients taking GCs was analyzed (Supplementary Table 1). Finally, evaluation of the total less head area is necessary for BMD measurement.
In conclusion, higher accumulated dose and duration of glucocorticoid are risk factors for a lower z-score at LSBMD for pediatric patients with chronic diseases. When the z-score was below -2, the greater OR of VF observed after 6 months to 1 year from previous LSBMD evaluation compared with other range of z-score. Clinically, this study suggests that patients treated with long-term glucocorticoids should be monitored for GC dose and baseline evaluation of BMD to predict skeletal complications such as osteoporotic fracture. Further large longitudinal studies evaluating serial BMD in chronic patients are required.