


Highlights
· There was the variation in the correlations and predictive factors of BMD and BMC at the lumbar spine and whole body among three %fat groups.
· The protective effect of lean mass on the bones did not vary with the amount of %fat.
· The positive effect of excess fat mass was on the whole body bones.
Introduction
Obesity in children and adolescents is an increasing public health concern that is associated with detrimental effects. In Asian countries, being overweight or obese, as defined by body mass index (BMI), is more prevalent in adolescents than it is in children, and more common in boys than in girls [1]. BMI is widely used to assess obesity [1,2] and is strongly correlated with %fat [3]; however, it does not directly measure body fat. Obesity is a state of excessive accumulation of body fat; thus, BMI assessment can lead to the under- or overestimation of obesity. BMI alone is less effective than is body fat assessment at predicting the risk factors of cardiometabolic diseases [4,5].
Using %fat-cutoff values to classify overweight and obese individuals is based on age, sex, ethnicity, and body fat assessment tools. Bioelectrical impedance analysis (BIA) and dual-energy x-ray absorptiometry (DXA) are widely used to measure body composition. The BIA is simple to use, inexpensive, and suitable for assessing %fat in large populations with reasonable accuracy [3,6]. However, the %fat derived from BIA is an underestimation compared to that from DXA, which is considered the reference method in clinical research and allows for the diagnosis and follow-up of osteoporosis [7,8]. In Korean children, %fat-cutoff values measured by BIA in overweight and obese cases were 17%–22% and 24%–30% for boys, and 24%–37% and 30%–53% for girls, respectively [9]. In Chinese adolescents, >30% of boys and >35% of girls had %fat measurements assessed by BIA that were higher than the 95th percentile [6], whereas those measured by DXA were >35% for boys and >40% for girls [10]. In Thai adolescents aged 15–18 years, the %fat measurements that were over the 95th percentile measured by BIA were >25% and >35% in boys and girls, respectively [3]. In addition, body fat assessment is important for monitoring adolescents with excess body fat who are at a greater risk of cardiometabolic diseases. According to a recent report, adolescents aged 10–19 years with %fat ≥20% for boys and ≥25% for girls were at greater risk than for cardiometabolic diseases than were those with normal body weight and adequate %fat [4].
Furthermore, evidence shows that excess adiposity during childhood affects bone development [11-13] resulting in increased fractures of the tibia and forearm [14-16]. The mechanisms involved in bone and fat development involve both osteoblasts and adipocytes derived from common mesenchymal stem cells (MSCs). The increased bone marrow fat in obesity shifts the differentiation of MSCs into adipocytes and inhibits proliferation and differentiation of osteoblasts, while simultaneously stimulating osteoclast differentiation [17]. Moreover, obesity is associated with low-grade inflammation that affects bone metabolism by upregulating osteoclast formation and activating bone resorption [12,13]. Several studies have shown an association between body fat and bone mineral density (BMD), which varies with sex, age, race/ethnicity, bone site, and the amount and distribution of body fat [18-21]. A previous study reported decreased areal BMD of the total body and lumbar spine (LS) with increased %fat and fat mass (FM) in children and adolescents [19]. Other studies have shown a negative association between %fat and BMD and a positive association between lean body mass (LBM) and BMD in boys compared to those in girls [20,21]. Total body fat and BMD had a positive association in younger girls (2–9 years) but an inverse association in older boys (12–17 years) [18]. Moreover, abdominal adiposity is associated with low BMD in older boys and girls. In addition, in children and adolescents with obesity, LM had a direct correlation with BMD at all bone sites and was the most important predictor of BMD, while the effect of FM on bone parameters was sex- and site-specific [22,23].
In contrast, body adiposity is also beneficial for bone accrual owing to increased mechanical loading on the bone. Previous studies have shown positive associations between body FM (BFM) and BMD of the LS and femoral neck in girls [22]. Girls with higher FM had a higher areal BMD at the femoral neck and total hip than boys did [24]. Trunk FM in boys had the strongest association with bone parameters [20]. Thus, the positive or negative effect of body fat on bone results from a balance between mechanical effects and biochemical effects (adipokines, cytokines, and paracrine release from adipocytes) that depend on age, sex, bone site, and fat distribution [13,25].
However, these studies generally classified children and adolescents as overweight or obese using BMI for age and sex, rather than %fat or FM. This study aimed to examine correlations among anthropometric, body composition, and bone parameters in adolescent girls with different %fat and to analyze the predictive factors of bone strength at different bone sites.
Materials and methods
1. Study participants
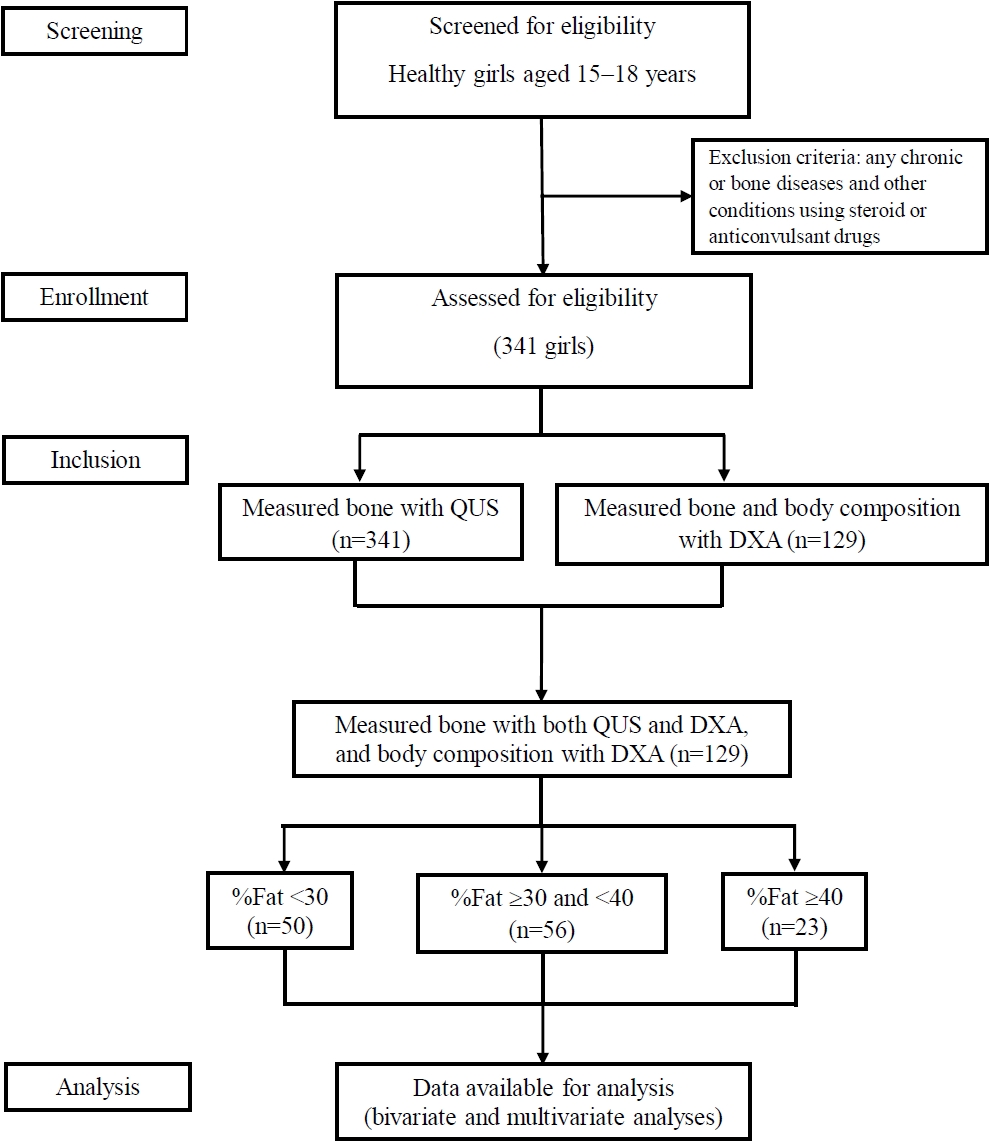
This cross-sectional study included healthy girls aged 15–18 years who were enrolled in 5 secondary schools in Southern Thailand. As shown in Fig. 1, girls were selected randomly and recruited for this study. The exclusion criteria included chronic or bone diseases, other conditions such as asthma, allergies, or gastritis, and the use of steroids or anticonvulsant drugs [26]. The speed of sound (SOS) at the radius and/or tibia was measured in 341 girls using quantitative ultrasound (QUS). The bone density of both LS and the whole body (WB), and body composition were measured in 129 girls using DXA, with their consent. Therefore, only these 129 girls were included in the study. Participants (n=129) were divided into 3 groups according to their %fat-for-age using the 50th and 95th percentiles as cutoff points [9,10]: group 1, %fat <30 (n=50); group 2, %fat ≥30 and <40 (n=56); and group 3, %fat ≥40 (n=23).
2. Anthropometric measurements
Body weight was measured without heavy clothing to the nearest 0.1 kg using an electronic-calibrated scale. Height was measured without shoes to the nearest 0.5 cm using a stationary vertical height board. BMI (kg/m2) was calculated as body weight divided by the square of height in meters. Waist circumference (WC, cm) was measured in a standing position at the narrowest part of the waist using a metal measuring tape [26].
3. Bone and body composition measurements
SOS (m/sec) was measured at the distal third of the radius and midshaft of the tibia on the nondominant side using a multisite bone sonometer, Sunlight Omnisense 7000P (Sunlight Medical Ltd., Jacksonville, FL, USA) [27-29] using a single ultrasonic probe. The equipment was calibrated before the bone measurements were made on each day according to the manufacturer's specifications. The age- and sex-specific mean SOS values for the radius and tibia were determined and compared with the sonometer's original built-in values obtained from Asian children. The z-score values were generated using the Asian pediatric reference database.
Bone parameters, including the bone mineral content (BMC) (g), BMD (g/cm2), and BMD-z-score (z-score) of the WB and LS (L1–4) were measured by DXA using the pediatric mode of Stratos, a pencil-beam densitometer (Diagnostic Medical Systems, Perols, France) [30]. The z-score is given as a percentile or standard deviation (SD) score, which compares the participants’ BMD with the average BMD for age, sex, and race. A z-score of zero is equivalent to the mean and z-scores of -1 and +1.5 are equivalent to values 1 SD below and 1.5 SD above the mean, respectively [31]. The scanner stability was checked throughout the course of the study using plots of daily spine phantom scans.
The body composition parameters that were measured using DXA on WB included LBM (g/cm2), BFM (g/cm2), LM (kg), FM (kg), %fat [(FM/total mass) × 100], %lean [(LM/total mass) × 100], and %bone. The LBM and BFM were calculated as LM (g) and FM (g) divided by the body area (cm2), respectively. The lean mass index (LMI) (kg/m2) and FM index (FMI) (kg/m2) were calculated as LM (kg) and FM (kg) divided by the height squared (m2), respectively.
4. Statistical analyses
Data analysis was performed using IBM SPSS Statistics ver. 22.0 (IBM Co., Armonk, NY, USA). Descriptive statistics (mean ± SD) were calculated. The 1-way analysis of variance and Tukey post hoc test were used to identify statistically significant differences of the means among the 3 groups. Correlations between anthropometric parameters, body composition, and bone parameters were analyzed using bivariate (Pearson correlation) and multivariate (multiple stepwise regression) analyses separately for the %fat groups. Multiple stepwise regression analyses were applied to determine the predictive factors of the bone parameters (dependent variables). The anthropometric and body composition parameters that were significantly correlated with bone parameters on bivariate analysis were selected as the independent variables.
Pearson correlation coefficient (r) and the standardized regression coefficient (β) were used to determine the strength of these correlations. R-squared (R2) values were the coefficients of determination. P-values <0.05, 0.01, or 0.001 were considered statistically significant.
5. Ethical statement
This study was performed in accordance with the Declaration of Helsinki. It was approved by the Ethics Committee on Human Rights Related to Research Involving Human Subjects, Walailak University, Thailand (WU56108). Written informed consent was obtained from all of the participants or their legal representative before enrollment.
Results
1. Characteristics of participants
The participants in this study (n=129) had a mean age of 16.09 0.47 years. They were divided into 3 groups according to %fat, and their characteristics were compared, as shown in Table 1. The mean %fat of groups 1, 2, and 3 significantly increased with an increase in body weight, BMI, WC, and body fat parameters (BFM, FM, and FMI) (P<0.001). For lean variables, the mean LBM of all groups were not significantly different. In contrast, the mean LM and LMI increased significantly with the increase in mean %fat of groups 1, 2, and 3 (P<0.001). In addition, the mean %lean and %bone of groups 2 and 3 decreased significantly with an increase in mean %fat, compared to those of group 1 (P<0.001).
With regard to the QUS parameters, Table 1 shows that the mean SOS and z-score of the tibia in group 1 were higher than were those in group 3 (P=0.004 and P=0.011, respectively). These parameters of the radius were not significantly different among the 3 %fat groups.
Furthermore, Table 1 shows that in the LS, group 1 had a lower mean BMD and BMC than did group 3, and a lower mean z-score than did groups 2 and 3 (P<0.05). In the WB, group 3 had the highest mean BMD, BMC, and z-score; the means of these parameters increased significantly with an increase in mean %fat in groups 1, 2, and 3 (P<0.001), except for the mean BMC of group 2.
2. Pearson correlations among anthropometric, body composition, and bone parameters
Correlations between %fat and anthropometric parameters for groups 1, 2, and 3 were analyzed (data not shown). Only group 2 demonstrated that body weight, BMI, and WC were positively correlated with %fat (r=0.704, r=0.784, and r=0.602, P<0.001, respectively), and negatively correlated with %lean (r=-0.693, -0.772, and -0.582, P<0.001, respectively).
The correlations between anthropometric parameters, body composition, and bone parameters of the tibia, LS, and WB in all participants are shown in Table 2. The SOS and z-score of the radius were not correlated with the anthropometric parameters or body composition, except for a weak positive correlation between SOS and %bone. In the tibia, both the SOS and z-score were negatively correlated with anthropometric variables (body weight, BMI, and WC) and body fat variables (BFM, FM, FMI, and %fat), and positively correlated with %lean and %bone. In the LS and WB, all bone parameters (BMD, BMC, and z-score) were positively correlated with all anthropometric parameters (body weight, BMI, and WC) and body fat and lean, except for a negative correlation with %lean. In contrast, the %bone was negatively correlated with all anthropometric parameters and body fat and lean, except for a positive correlation with %lean. In addition, the %bone was not correlated with the BMD, BMC, or z-score at either the LS or WB, except for a negative correlation with the WB-BMC.
Furthermore, the correlations between anthropometric parameters, body composition, and bone parameters of the tibia, LS, and WB of participants in groups 1, 2, and 3 (divided by %fat) are shown in Tables 3–5, respectively. However, these correlations were not observed at the radius (data not shown).
For group 1, Table 3 shows that at the tibia, both the SOS and z-score had weak negative correlations with the body weight, BMI, and BFM, while the SOS had weak negative correlations with the lean variables (LBM, LM, and LMI) and FMI. In the LS and WB, all parameters (BMD, BMC, and z-score) were positively correlated with the body weight, BMI, and lean variables. In addition, the WB-BMC showed a mild positive correlation with height, FM, and %fat. In contrast, the %bone was negatively correlated with the WC and fat variables (BFM, FM, FMI, and %fat). However, there were positive correlations between the %bone and all bone parameters at the LS and WB.
In group 2, Table 4 shows that the SOS and z-score of the tibia had no correlation with the anthropometric variables. Weak positive correlations were observed in %lean, but the fat variables (except FM) had weak negative correlations with both parameters of the tibia. In the LS and WB, there were positive correlations between all bone parameters, anthropometric variables (except height) and body composition (except %lean and %bone). Height was moderately correlated with the BMC at both sites. In contrast, all bone parameters were negatively correlated with %lean, but had no correlations with %bone. However, the %bone was negatively correlated with all anthropometric and body composition variables, except for a positive correlation with %lean.
Furthermore, there were no correlations among the variables at the tibia in group 3 (data not shown). Table 5 shows that the height and LM of group 3 were key variables that had strong positive correlations with all bone parameters of the LS and WB-BMC. In addition, the WB-BMC was strongly correlated with the body weight and FM, and the other bone parameters were moderately correlated with both parameters. In contrast, the %bone was negatively correlated with BMI, WC, LMI, and FMI.
3. Multiple stepwise regression analyses of the predictive factors of bone parameters
According to Pearson correlations, the lean variables (LBM, LB, and LMI) demonstrated strong positive correlations with bone parameters (BMD, BMC, and z-score) at both the LS and WB in groups 1 and 2 (Tables 3 and 4). Moreover, the body fat variables (BFM, FM, and FMI) showed strong positive correlations with all bone parameters at both sites in group 2 (Table 4). However, these strong correlations did not appear in group 3 (Table 5). Therefore, the key predictive factors of bone parameters at the LS and WB were analyzed and are shown in Table 6.
In group 1, the LBM was a key predictive factor of all bone parameters at both the LS and WB. The body weight was also a predictive factor of the WB-BMC. In contrast, FM was a negative predictor of %bone.
In group 2, predictive factors varied by the bone site and bone parameters. In the LS, the LBM was a key predictive factor of the BMD and z-score, while the LM was a key predictive factor of the BMC. In the WB, body weight and LBM were predictive factors of all bone parameters, and height was a copredictive factor for the WB-BMC. In contrast, the BFM was a negative predictor of the %bone. In addition, at the tibia, the %lean was a positive predictor of the z-score, whereas the BFM was a negative predictor of the SOS.
Furthermore, in group 3, the FM was a key predictive factor of all bone parameters of the WB, and height was a key predictive factor for all bone parameters of the LS. In contrast, the FMI and WC were negative predictors of the WB-BMC and %bone, respectively.
Discussion
This study included 3 groups of adolescent girls, who were classified as having normal %fat (<30), over %fat (≥30 and <40), and excess %fat (≥40). The mean %fat and FMI of these groups were close to the 15th, 65th, and 95th percentiles for age, respectively [10]. Only the group with over %fat showed a relationship between %fat and BMI; the mean BMI in this group was close to the BMI-for-age at the 65th percentile [2]. A recent study [3] showed that the %fat-for-age at the 50th and 95th percentiles measured by BIA in Thai girls were 25% and 35%, respectively. These measurements are lower than those measured by DXA in this study. Therefore, the %fat-cutoff values used to classify the degree of body fat may differ depending on the assessment method.
This study found that the SOS and z-score of the tibia decreased in participants with %fat ≥30 and were negatively correlated with body fat variables, whereas those of the radius were not associated with body fat variables. When compared with previous results [26,28], the mean SOS at both sites in participants with normal %fat was in the normal range, with a higher SOS and lower z-score for the radius than for the tibia [28]. A recent study showed that overweight and obese children have higher rates of fractures in the distal third of the tibia than do normal weight children, which involves the increased adiposity in the bone and physeal abnormalities in children who are overweight or obese [32]. In addition, evidence has revealed an inverse correlation between the tibial SOS and adiposity measurements (%fat and skinfold) [33], and suggested that the decreased SOS of the tibia in children with obesity is independent of the severity of the obesity [34]. Although this study found that the SOS of the radius did not vary with body composition, a previous study reported a greater risk of forearm fracture in children with overweight and obesity (compared to that of normal weight children) because of changes in bone geometry with a high proportion of fat relative to muscle in the forearm [16]. However, fractures of the upper and lower extremities are very frequent events in children and adolescents. Therefore, the negative effect of increased body fat on attaining peak bone mass (PBM) ought to be of great concern.
The study's main finding was the variation in the correlations and predictive factors of the bone parameters at the LS and WB. The BMD and BMC at both sites were strongly correlated with lean variables in the normal %fat group, lean and fat variables in the over %fat group, and both LM and FM in the excess %fat group. Therefore, the protective effect of LM on the bones of adolescent girls does not vary with the amount of %fat, whereas the positive effect of FM appears in girls with %fat above normal (≥40% or ≥95th percentile for age). The body composition refers to the relative proportion of LBM and BFM within the body. LBM includes muscle mass, body water, and bone mass. Body composition parameters are known to be associated with BMD. Recent studies have shown that LM, not FM, is the main determinant of peak BMD in young adults and is a key predictor of BMD [26,35]. In addition, the LM was the most important predictor of bone size and mineralization; girls with a LM >19 kg showed 12%–19% more BMC than did those with less LM [36]. Previous studies have proposed that the association between LM and bone is consistent across different skeletal sites, whereas the association between FM and bone is difficult to conclude owing to methodological differences such as age, skeletal sites, and statistical approaches [20,37]. The positive effect of LM on bone is explained by the adaptation of bone to biomechanical forces and the close relationship between bone and muscle force or size [38,39]. A large FM increases mechanical loading on the bone, while adipose tissue in obesity is also a key source of aromatase, which promotes estrogen synthesis [40]. Estrogen (17β-estradiol) exerts protective effects on the bone through many mechanisms, such as the repression of pro-osteoclastic cytokines in T cells, induction of osteoclast apoptosis, and repression of proinflammatory cytokines in osteoblasts. [40,41].
The predictive factors of bone strength differed in girls with %fat less than and more than the 95th percentile for age (<40% and ≥40%). As shown in girls with %fat <40, the LBM mainly predicted an increase in BMD and BMC of the LS, whereas body weight mainly predicted an increase in WB bone parameters. Previous studies have shown that the LBM is the main determinant of bone strength at both weight-bearing and non-weight-bearing skeletal sites [42], and that an increase in BMD due to increased body weight involves a mechanical effect and a greater amount of estrogen [41]. However, the association between muscle mass and bone differs between the sexes; muscle mass is associated with BMC and BMD in the total body of boys and the LS of girls [39]. In contrast, in girls with %fat ≥40, FM was a key positive predictor of WB bone parameters, whereas FMI was a negative predictor of WB-BMC. As mentioned above, the FM in girls increased with an increase in %fat, but height was not affected by excess %fat. Therefore, the FMI may be a better parameter for discriminating adiposity and predicting WB bone strength in girls with excess body fat. However, both FMI and FM have greater ability in detection of early adiposity changes in children with obesity [43]. In addition, height could predict strength of the LS in girls with excess %fat, which may be due to the lack of variation in height with increased body fat.
Furthermore, in contrast to BMD and BMC, the %bone decreased as the %fat increased. The FM and BFM were analyzed as key negative predictors of %bone in girls with %fat <40. In girls with %fat ≥40, increased WC, which indicates the accumulation of abdominal fat, could predict a decrease in %bone. In addition, this study found negative correlations between the %bone, BMI, LMI, and FMI in girls with excess %fat; therefore, these parameters may be considered as indices of the decreased %bone.
Although this study did not report the participants' menarche, the onset of menarche has been reported to be an important factor influencing PBM gain among adolescents and young people [44]. Women with early menarche have higher bone mass, whereas women with late menarche are at risk for osteoporosis. Gonadal sex steroid secretion including the rise in estrogen levels at menarche is associated with the skeletal longitudinal and radial growth and the regulation of bone turnover [45,46]. Furthermore, adolescent girls with obesity have been shown to have earlier onset of puberty and menarche than those without obesity [47].
The limitation of this study was the small sample size of the excess %fat group compared to the other groups. The use of DXA to measure bone and body composition was difficult for these participants to accept; hence, such measurements would have to be repeated in severe obesity. This study recruited girls in the same age range; thus, the same Tanner stage was assumed. The strengths of this study were the classification of obesity by %fat, which could predict fat accumulation better than BMI based on the evidence, and the use of DXA for measuring bone density and important indices of body composition. Further studies should focus on population cohorts, including comparisons between males and females and data collection on the puberty stage and associated sex hormones.
In conclusion, the positive effect of LM on BMC was clear and did not vary with %fat. Predictive factors for bone strength differed among the %fat groups. LBM is a key predictor of bone as measured by DXA, whereas BFM is a negative predictor of %bone in normal and over %fat. The FM is a key positive predictor of WB bone parameters in those with excess %fat. Additionally, increased WC or abdominal adiposity can predict a decrease in %bone.