


Highlights
· Late endocrine effects after hematopoietic stem cell transplantation (HSCT) occur frequently in childhood cancer survivors.
· Short stature and diabetes mellitus are common in the group of patients prepubertal at HSCT, whereas hypogonadism and osteoporosis are more prevalent in those of pubertal age at HSCT.
· Pubertal age at HSCT is a considerable risk factor for endocrine complications.
· Surveillance for endocrine complications needs to be specified according to the age at HSCT to provide the best possible treatment options for childhood cancer survivors.
Introduction
With the increased survival rate of patients with childhood cancer, long-term endocrine and metabolic sequelae are important challenges for both clinicians and patients. Hematopoietic stem cell transplantation (HSCT) is an important treatment modality for childhood cancer; however, it requires a myeloablative conditioning regimen comprising high-dose chemotherapeutic agents and/or total body irradiation (TBI), which affects multiple endocrine organs including the hypothalamus, pituitary gland, thyroid gland, and gonads [1]. Therefore, treatment-related complications, including endocrine and metabolic disorders, have steadily increased in childhood cancer survivors [2].
Endocrine complications frequently occur as a late effect of HSCT. Preconditioning regimens for HSCT can affect the endocrine organs, leading to short stature, hypogonadism, hypothyroidism, and metabolic complications in long-term survivors of HSCT [3,4]. Alkylating agents increase the risk of those complications. Radiation therapy also causes damage to endocrine organs, leading to anterior pituitary hormone deficiencies, thyroid diseases, gonadal dysfunctions, and metabolic syndrome, the incidence of which is closely related to the cumulative dose of alkylating agents and the radiation field [5]. In addition, graft-versus-host disease (GVHD) itself and prolonged glucocorticoid treatment to control it can contribute to endocrine complications such as growth failure, delayed puberty, osteoporosis, iatrogenic Cushing syndrome, obesity, and hyperglycemia [6].
Childhood was already known to be a period more vulnerable to endocrine and metabolic complications than adulthood [7]. Although demographic factors, chemotherapy, radiation, GVHD, and glucocorticoid use all affect the development of endocrine complications, previous studies reported that the age at HSCT significantly influences clinical outcomes and chronic health issues in childhood cancer survivors [8,9]. Several comparative studies have assessed endocrine outcomes in childhood cancer survivors according to age or pubertal stage at HSCT [10-12]. They reported that age at HSCT affects growth and gonadal function. However, a large-scale and comprehensive analysis is needed to investigate the prevalence and risk factors for late endocrine effects after HSCT in Korea. Therefore, this study investigated the long-term endocrine sequelae of HSCT and the risk factors for endocrine and metabolic complications in a relatively large cohort of children and adolescents who underwent HSCT.
Materials and methods
1. Subjects
From January 2000 to December 2022, 526 patients underwent HSCT at the Department of Pediatrics in Asan Medical Center Children's Hospital, Seoul, Korea. The inclusion criteria for this study were as follows: (1) patients younger than 18 years who were diagnosed with hematologic diseases or noncentral nervous system solid tumors; (2) patients who were alive during the study period; (3) patients who were followed up for at least 1 year after HSCT; and (4) patients who had reached pubertal age (male ≥ 12; female ≥ 10 years old) at the time of analysis. Using those criteria, this study included 200 patients after excluding 173 patients who died, 15 patients who had relapsed underlying diseases or pre-existing endocrine diseases, 120 patients who had not reached pubertal age, and 18 patients who were lost to follow-up.
2. Data collection and endocrine assessment
The following data were retrospectively collected: anthropometric measurements, underlying disease, pretransplant conditioning regimens (alkylating agents or TBI), and GVHD. The cumulative dose of alkylating agents was estimated using the cyclophosphamide equivalent dose (CED) [13]. GVHD is a complication of HSCT that is defined as a systemic disorder in which the graft's immune cells attack the recipient's tissues, especially the skin, gastrointestinal tract, and liver. GVHD was categorized as acute (within 100 days after HSCT) and chronic (more than 100 days after HSCT), based on the National Institutes of Health Consensus criteria [14].
Endocrine complications were assessed by clinical examination and laboratory tests. Short stature was defined as a height standard deviation score (SDS) < –2 according to the age- and sex-specific growth chart [15]. Growth hormone deficiency (GHD) was defined as a peak GH level < 10 ng/mL in 2 separate stimulation tests using levodopa and insulin. Obesity was defined as a body mass index above the 95th percentile. Dyslipidemia was defined as total cholesterol ≥ 200 mg/dL, low-density lipoprotein (LDL) cholesterol ≥ 130 mg/dL, triglyceride ≥ 130 mg/dL, or high-density lipoprotein (HDL) cholesterol < 40 mg/dL in children [16] and as total cholesterol ≥ 240 mg/dL, LDL cholesterol ≥ 160 mg/dL, triglyceride ≥ 200 mg/dL, or HDL cholesterol < 40 mg/dL in adults [17]. Hypothyroidism was defined as free thyroxine below the normal range (0.8–1.9 ng/dL) with a concurrent measurement of thyroid-stimulating hormone (normal range, 0.4–5.0 µU/mL). Hypogonadism was defined clinically as pubertal failure or arrest by examining breast development in females and testicular or pubic hair development in males. Luteinizing hormone, follicle-stimulating hormone, and testosterone or estradiol levels were measured [18]. Dual-energy x-ray absorptiometry was used to diagnose osteoporosis, which was defined as a bone mineral density (BMD) z-score < –2 SDS in the lumbar spine and femur neck [19]. Vitamin D deficiency was defined as a level of 25-hydroxyvitamin D3 (25-OHD3) < 20 ng/mL [20].
3. Statistical analysis
IBM SPSS Statistics ver. 21.0 (IBM Co., Armonk, NY, USA) was used for the statistical analyses. Results are presented as means±standard deviations for normally distributed variables. Skewed variables are expressed as medians and ranges. Categorical variables are presented as frequencies and percentages. To compare differences between the prepubertal and pubertal groups, the Student t-test and chi-square test were performed. Normality testing for the data distribution was performed using the Kolmogorov-Smirnov test. Kaplan-Meier curves were generated to illustrate the cumulative incidence of endocrine complications. A multivariate analysis was conducted including sex, underlying diseases, age at HSCT, type of HSCT, CED, radiation dose, GVHD, and glucocorticoid use. The risk factors for outcomes after HSCT were determined using multivariable Cox proportional-hazards models and are presented as hazard ratios (HRs) and 95% confidence intervals (CIs). The variables in the multivariate Cox regression analysis were sex, underlying diseases, age at HSCT, type of HSCT, CED, radiation dose, GVHD, and glucocorticoid use, which were selected using univariate analyses (data not shown). All tests were 2-sided, and P-values < 0.05 were considered statistically significant.
4. Ethical statement
The retrospective medical chart reviews were conducted with approval from the Institutional Review Board (IRB) of Asan Medical Center, Seoul, Korea (IRB No. 2022-0026). The need to obtain informed consent was waived by the IRB because the clinical data were obtained retrospectively without a molecular analysis.
Results
1. Baseline characteristics
The clinical characteristics of the 200 HSCT patients (119 males and 81 females; 100 prepubertal and 100 pubertal at the time of HSCT) are summarized in Table 1. The median age at diagnosis of the underlying diseases and at HSCT were 9.9 years (range, 0.1–18.0 years) and 10.8 years (range, 0.6–25.2 years), respectively. The median follow-up duration after HSCT was 14 years (range, 2.4–24.6 years). Acute myeloid leukemia was the most common underlying disease (n=86, 43%). Nineteen patients (9.5%) underwent HSCT more than twice due to relapse of their underlying diseases. Ninety-six patients (48%) underwent radiation therapy for their underlying diseases, and 71 patients (35.5%) underwent TBI as their preconditioning regimen. GVHD occurred in 75 patients (37.5%): 3 of them with posttransplant bronchiolitis obliterans underwent lung transplantation.
One hundred patients (71 males and 29 females) underwent HSCT at prepubertal age (median, 7.2 years; range, 0.6–11.6 years) and were classified as the prepubertal group. The other 100 patients (48 males and 52 females) had HSCT at pubertal age (median age, 14.8 years; range, 10.0–25.2 years) and were classified as the pubertal group (Table 1). The pubertal age group contained more females than the prepubertal group (52% vs. 29%, P=0.001). The prepubertal and pubertal groups did not differ significantly in the baseline characteristics (underlying diseases, type or number of HSCTs, preconditioning regimen, GVHD, and glucocorticoid use).
2. Endocrine sequelae after HSCT
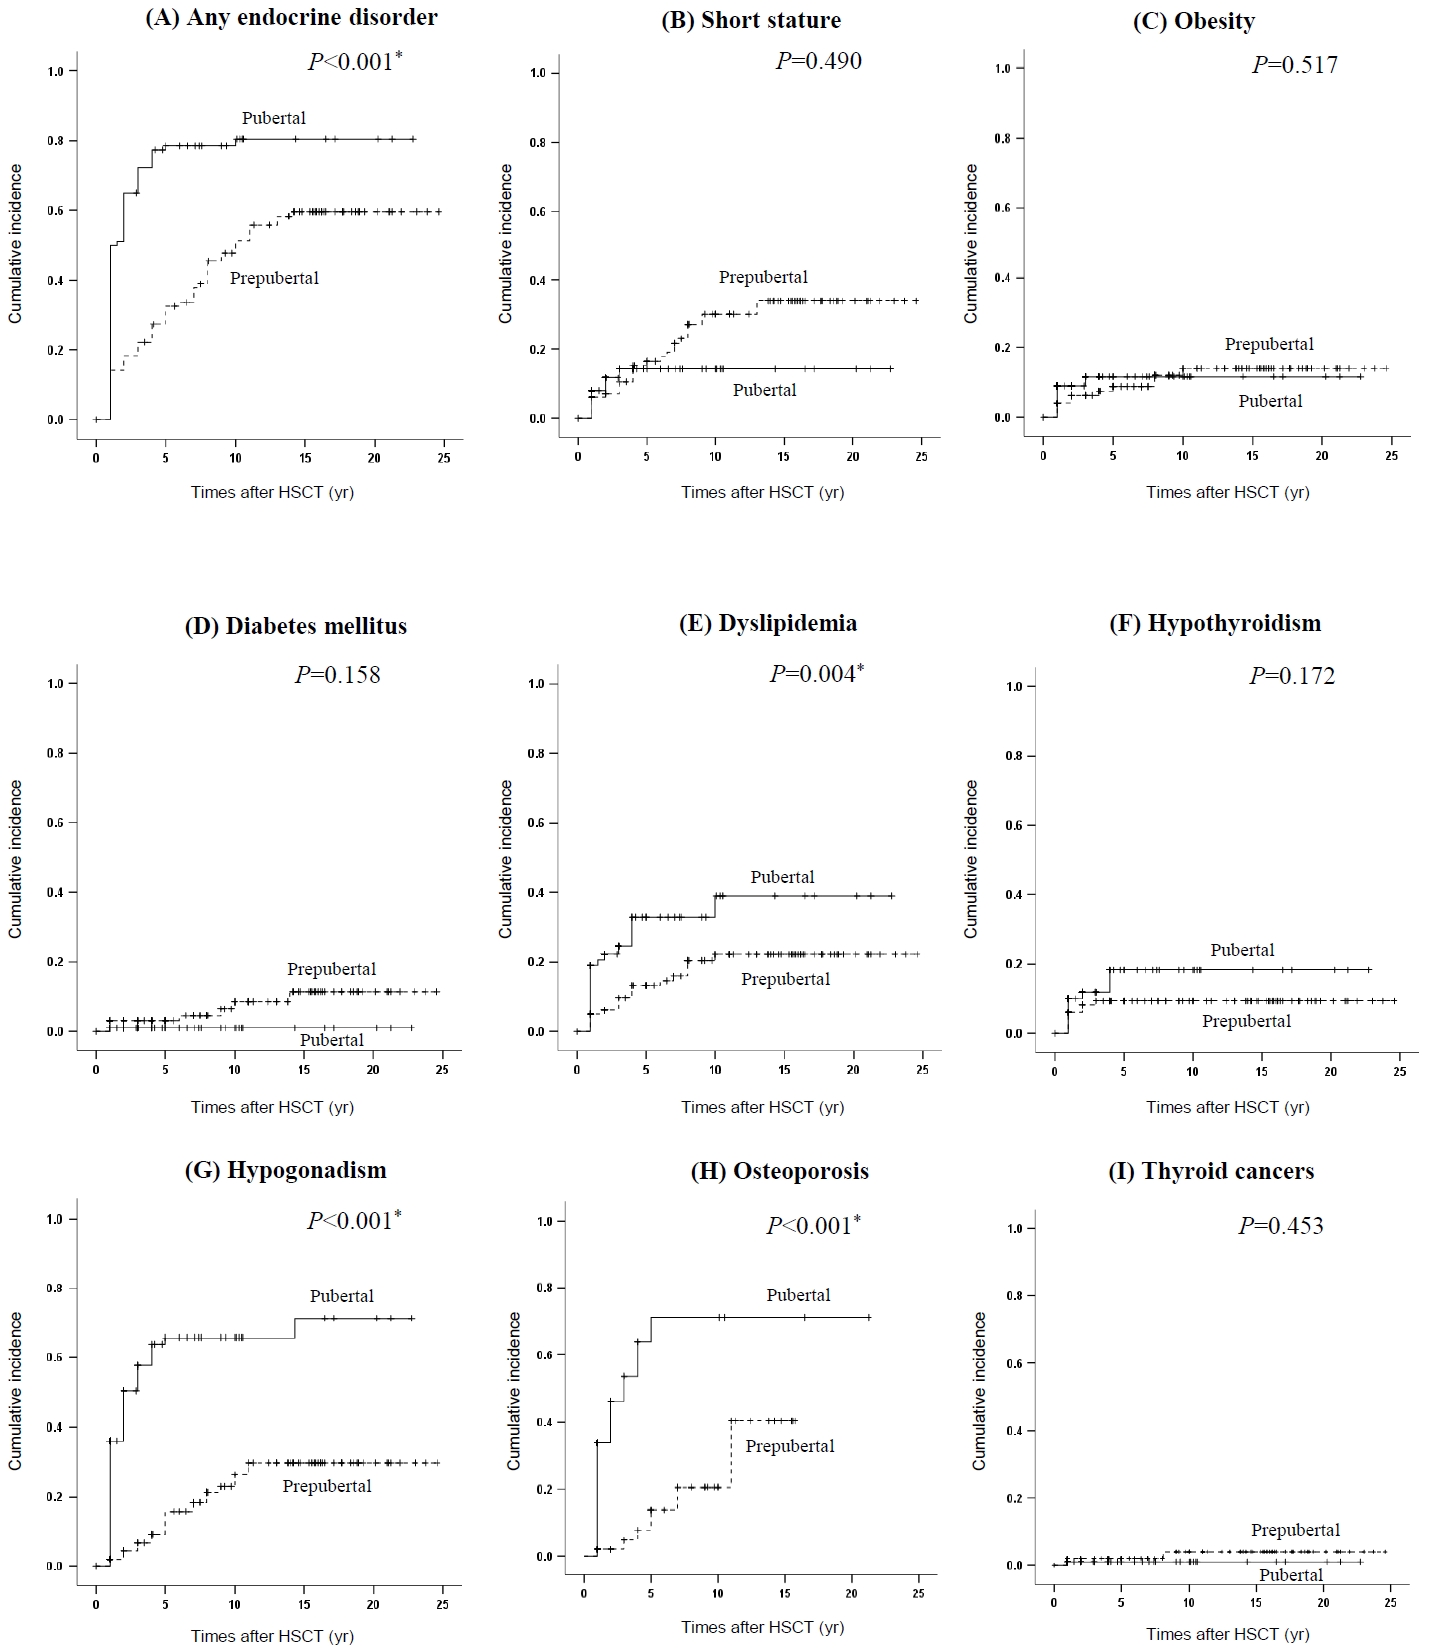
Overall, endocrine complications occurred in 135 of the 200 patients (67.5%): 56 patients in the prepubertal group and 79 patients in the pubertal group (P=0.001) (Table 2). The cumulative incidences of endocrine complications after HSCT are depicted in Fig. 1. The 10-year cumulative incidences of any endocrine dysfunction were 80.4% and 47.7% in the pubertal and prepubertal groups, respectively (P<0.001) (Fig. 1A). For any endocrine complication, being female, pubertal age at HSCT, and glucocorticoid use showed adjusted HRs of 1.78 (95% CI, 1.25–2.52; P=0.001), 2.42 (95% CI, 1.65–3.50; P<0.001), and 2.29 (95% CI, 1.26–4.15; P=0.006), respectively, in the multivariate analysis (Table 3).
1) Short stature
The mean height SDSs for the prepubertal and the pubertal groups were -1.35 and -0.43, respectively (P<0.001). The prepubertal group had a higher prevalence of short stature than the pubertal group (27% vs. 11%; P=0.004). Twenty-two patients with short stature (57.9%) underwent TBI. GHD was confirmed in 2 patients in the prepubertal group and 1 patient in the pubertal group. Radiation exposure gradually increased the risk of short stature (adjusted HR of 1–29 Gy 2.13, 95% CI, 1.06–4.30; P=0.034; adjusted HR of ≥30 Gy 2.91; 95% CI, 1.03–8.18; P=0.043) (Table 3).
2) Diabetes mellitus and dyslipidemia
Diabetes mellitus (DM) developed in 7 patients in the prepubertal group and one patient in the pubertal group (7% vs. 1%, P=0.03). The mean random glucose level was 281 mg/dL, and the mean glycosylated hemoglobin was 8.4% in patients with DM. Type 1 DM occurred in one patient within the prepubertal group. Type 2 DM was found in 6 patients in the prepubertal group and 1 in the pubertal group (6% vs. 1%, P=0.054). All patients with type 2 DM had history of GVHD requiring glucocorticoid treatment. The frequency of obesity and dyslipidemia did not differ significantly between the prepubertal and pubertal groups. However, the 10-year cumulative incidence of dyslipidemia was significantly higher in the pubertal group than the prepubertal group (39% vs. 22.2%, P=0.004) (Fig. 1E). Pubertal age at HSCT increased the risk of dyslipidemia (adjusted HR 2.38; 95% CI, 1.27–4.44; P=0.007) (Table 3).
3) Hypogonadism
Hypogonadism was more common in the pubertal group (n=58) than in the prepubertal group (n=22) (P<0.001). Most cases were hypergonadotropic hypogonadism (78 of 200, 39%). However, hypogonadotropic hypogonadism was observed in 2 patients: 1 patient with Ewing sarcoma who underwent head, neck, and spine irradiation with dose of 95 Gy and 1 patient with acute lymphoblastic leukemia who underwent TBI and lung transplantation. The 10-year cumulative incidence of hypogonadism was 65.7% and 26.3% in the pubertal and prepubertal groups, respectively (P<0.001) (Fig. 1G). The risks of hypogonadism were significantly increased in female patients (adjusted HR, 5.70; 95% CI, 3.34–9.73; P<0.001), those of pubertal age at HSCT (adjusted HR, 4.55; 95% CI, 2.62–7.92; P<0.001), and those with a total radiation dose of ≥30 Gy (adjusted HR, 2.52; 95% CI, 1.26–5.05; P=0.009) (Table 3). Sixty-four of the 80 patients (80%) with hypogonadism received sex hormone replacement. In contrast, no patients developed central precocious puberty.
4) Osteoporosis and vitamin D deficiency
BMD and 25-OHD3 levels were measured in 104 patients. Osteoporosis was more prevalent in the pubertal group (30 of 59, 50.8%) than the prepubertal group (10 of 45, 22.2%) (P=0.003). The mean BMD z-scores for the lumbar spine and femur neck in the pubertal group were significantly lower than those in the prepubertal group (Table 2). The 10-year cumulative incidence of osteoporosis was 71.3% and 20.6% in the pubertal group and prepubertal group, respectively (P<0.001) (Fig. 1H). Osteoporosis was significantly associated with pubertal age at HSCT (adjusted HR, 5.05; 95% CI, 2.27–11.22; P<0.001) (Table 3). Vitamin D deficiency was observed in 23 patients in the prepubertal group and 33 in the pubertal group (51.1% vs. 55.9%, P=0.573), and the mean 25-OHD3 levels did not differ significantly between the groups.
5) Thyroid diseases
Primary hypothyroidism was found in 8 patients in the prepubertal group and 11 in the pubertal group (P=0.467). A radiation dose of ≥30 Gy increased the risk of primary hypothyroidism (adjusted HR, 6.14; 95% CI, 1.98–19.06; P=0.002) (Table 3). Central hypothyroidism was observed in 1 patient in the prepubertal group and 2 patients in the pubertal group. Two patients with central hypothyroidism received TBI. Four patients developed thyroid cancers: 2 with papillary carcinoma and 2 with follicular carcinoma. Three of them had previously been treated with TBI.
Discussion
In this study, endocrine complications occurred in 67.5% of patients who underwent pediatric HSCT, with higher prevalence in patients who underwent HSCT at pubertal age. Short stature and DM were common in the prepubertal group, whereas hypogonadism and osteoporosis occurred more frequently in the pubertal group. Risk factors for any endocrine complication were being female, pubertal age at HSCT, and glucocorticoid use. Radiation exposure was likely to cause short stature, and high-dose radiation was strongly associated with primary hypothyroidism. Risk factors for hypogonadism were being female, pubertal age at HSCT, and high-dose radiation. Pubertal age at HSCT was also associated with an increased risk of osteoporosis and dyslipidemia.
Recent studies have reported the prevalence and risk factors for late endocrine effects after HSCT [8-12,21]. However, those study populations differed considerably in their demographic characteristics, underlying diseases, method of HSCT, preconditioning regimens, and presence or severity of GVHD. The overall prevalence of late endocrine effects from HSCT in those studies ranged from 35.7% to 65.2% [8,9,12]. Our group previously reported that endocrine complications occurred in 30% of children with noncentral nervous system solid tumors; among them, 63.3% had undergone HSCT [21]. In this study, the prevalence of any endocrine complication after HSCT was relatively high (67.5%). This result might be attributed to the underlying diseases and treatment-related complications during our long-term follow-up duration. Most patients (90%) had malignancies requiring high cumulative doses of alkylating agents and radiation, leading to the high prevalence of endocrine and metabolic complications. Moreover, recent HSCT using human leukocyte antigen (HLA)-mismatched or haploidentical donors requires high-dose preconditioning regimens, increases the risk of GVHD, and is associated with a high frequency of endocrine complications [22,23].
The prevalence of endocrine complications reported here is compatible with those reported in previous studies; likewise, hypogonadism, dyslipidemia, and osteoporosis were previously reported to be common endocrine dysfunctions [8,9,11,12]. Those complications were predominant in patients who underwent HSCT at pubertal age. One-third of patients developed hypogonadism and osteoporosis, and those conditions were associated with older age at HSCT [8,9,24,25]. Hypogonadism predisposes patients to osteoporosis and metabolic complications, including dyslipidemia [26,27]. Dyslipidemia after HSCT causes injury to endothelial cells, leading to cardiovascular diseases such as hypertension and coronary artery diseases [28,29]. The prevalence of metabolic syndrome, characterized by obesity, insulin resistance, dyslipidemia, and hypertension, increased in patients who underwent HSCT [3,24]. Potential risk factors for posttransplant DM include age, hypothalamic and pituitary functions, GVHD, and immunosuppressive therapy [30]. Previously, our group reported 2 patients with severe aplastic anemia who developed DM caused by hemochromatosis after multiple transfusions [31]. However, those patients were excluded from this study because DM developed prior to HSCT, and they were not followed up for at least 1 year after HSCT. The 8 patients with DM in the present study had no other clinical signs of hemochromatosis.
Hypogonadism is a common endocrine sequelae after HSCT [8-12]. Hypergonadotropic hypogonadism with primary gonadal failure was more common than hypogonadotropic hypogonadism because of chemotherapy- and radiation-induced gonadal tissue damage [32-34]. A few cases of hypogonadotropic hypogonadism have been reported after HSCT [12,35], including 2 patients in this study. One patient received high-dose cranial irradiation, and the other patient underwent TBI and lung transplantation and was considered to have functional hypogonadotropic hypogonadism.
Multiple variables are linked to the development of endocrine complications after HSCT: age, sex, underlying diseases, treatment modalities, preconditioning regimens, GVHD, and glucocorticoid use [4,36]. Among them, age at HSCT is a critical factor for endocrine sequelae [37]. This study highlights the importance of age at HSCT for endocrine complications, characterizing differences in endocrine outcomes between prepubertal and pubertal groups. Notably, patients who underwent HSCT at pubertal age showed a trend toward more endocrine complications than the prepubertal group. Consistent with these results, previous reports showed that a younger age at HSCT was associated with short stature, and older age was associated with higher risks of hypogonadism and osteoporosis [9,24,38,39]. Furthermore, our study demonstrates that being female, pubertal age, and receiving a radiation dose of ≥30 Gy are important risk factors for hypogonadism, consistent with previous studies [8,9,11,12,21]. Females have a limited oocyte reserve and are developing follicles in puberty that are susceptible to gonadal failure due to the preconditioning regimens of HSCT [4]. Gonads can be easily damaged by low-dose radiation, leading to gonadal failure [40]. Those risk factors are thus closely related to endocrine complications after HSCT.
This study has several limitations. Because of its retrospective study design in a single academic center, some data were missing, and laboratory tests were not performed systematically in all patients. In addition, selection bias could exist because 173 patients died after HSCT. However, this study included a relatively large number of patients and had a long follow-up duration.
In conclusion, this study demonstrates that endocrine complications are relatively common after HSCT in children and adolescents. The age at HSCT is a considerable risk factor for endocrine sequelae. Other risk factors were sex, HLA donor type, CED, radiation dose, GVHD, and glucocorticoid use, which should be also considered when evaluating endocrine sequelae during follow-up visits. Further study is required to establish an optimized preconditioning regimen that might modify the risk of endocrine sequelae after HSCT.