


Highlights
· The measurement of pituitary volume (PV) cannot be used for differential diagnosis between growth hormone (GH) deficiency and idiopathic short stature (ISS).
· In patients with GH deficiency, PV may be a good response predictor for GH treatment.
Introduction
Magnetic resonance imaging (MRI) can be used for assessing the morphology or abnormalities of the pituitary gland in children with short stature [1]. Current guidelines recommend that, in cases of growth hormone (GH) deficiency, imaging of the pituitary gland be performed to re veal abnormalities that can explain the etiology of GH deficiency and can be a contraindication to GH therapy [2]. Some previous studies have reported that structural abnormalities in the pituitary gland are associated with short stature [1,3,4]. Anatomical anomalies of the pituitary gland were more frequent in children with GH deficiency than in those with short stature from other causes. 3,5) Other reports suggest that, in the absence of structural anomalies, short stature is related to the size of the pituitary gland and the amount of GH secretion [6]. Some other studies have shown differences in pituitary volume (PV) between subjects with GH deficiency and those with idiopathic short stature (ISS) [4,5,7,8]. Previous studies were limited to children with GH deficiency, and no previous studies have characterized the relationship between PV and the effectiveness of GH treatment in patients with ISS or GH deficiency.
The purposes of this study were: (1) to determine if PV can distinguish patients with GH deficiency from those with ISS, (2) to validate an association between PV and severity of GH deficiency, and (3) to compare the PV between good and poor response groups in children with GH deficiency or ISS after 1 year of treatment.
Materials and methods
1. Participants
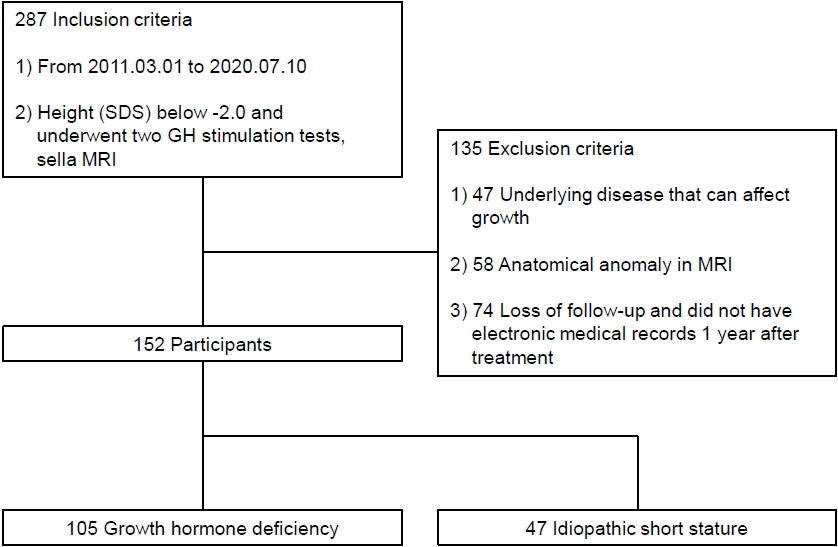
We designed a retrospective case-control study that recruited children who visited Severance Children's Hospital from March 2011 to July 2020. These children's heights were below a standard deviation score (SDS) of -2, and these children underwent two GH stimulation tests and sella MRI. Initial evaluation included 287 children. Patients with underlying diseases that could affect their growth such as hypothyroidism, panhypopituitarism, tubulointerstitial nephropathy, congenital heart disease, Russell-Silver syndrome, Turner syndrome, Noonan syndrome, congenital megacolon, rickets, and achondroplasia (n=47) were excluded. Also excluded were those with anatomical abnormalities on sella MRI such as pituitary adenoma, craniopharyngioma, medulloblastoma, empty sella syndrome, Rathke cleft cyst, and supratentorial brain tumor (n=58). Additionally, patients who were lost to follow-up and did not have electronic medical records through 1 year after treatment (n=74) were excluded. After exclusions, the total number of participants in the study was 152. GH deficiency was defined as: (1) short stature of a height below the third percentile for age and sex; (2) delayed bone age (BA); and (3) peak GH level below 10 ng/mL on two stimulation tests. For analysis, we also divided the GH deficiency into severe deficiency (peak GH < 5 ng/mL), moderate deficiency (peak GH 5–6.9 ng/mL), and mild deficiency (peak GH 7–9.9 ng/mL) groups. ISS was defined as a height below the third percentile for age and sex without any other identifiable hormonal, skeletal, or systemic disorders. Of the 152 participants in the study, 105 had GH deficiency and 47 had ISS (Fig. 1).
2. Methods
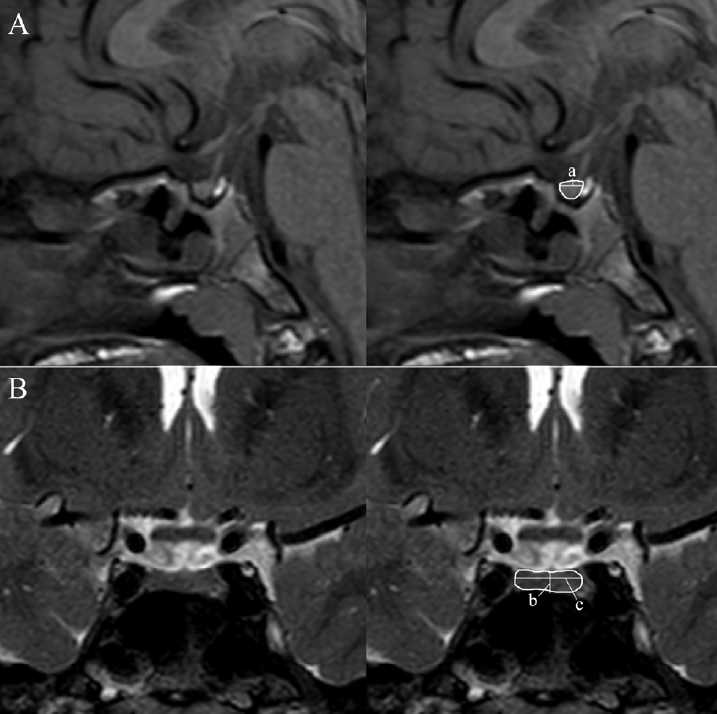
All participants underwent a physical examination, biochemical study, and imaging study at the start of treatment; height was measured every six months thereafter. Anthropometric measures were obtained using a Harpenden stadiometer and digital scale. Growth parameters, including height and midparental height (MPH), were standardized as a standard deviation score (SDS) according to the 2017 Korean growth standard [9]. MPH was defined as the mean of the parental heights minus 6.5 cm in girls and plus 6.5 cm in boys. The GH, insulin-like growth factor I (IGF-I), and IGF binding protein-3 (IGFBP-3) levels were measured by chemiluminescence immunoassay using the Immulite 2000 Immunoassay System (Siemens Healthcare Diagnostics Inc., Erlangen, Germany). The IGF-I SDS and IGFBP-3 SDS were calculated according to the Korean standard reference [10]. For GH stimulation tests, we assessed serum GH concentration levels at 0, 30, 60, 90, and 120 minutes after provocation by insulin (0.1 unit/kg, intravenously) and L-dopa (125 mg, body weight under 12.5 kg; 250 mg, body weight 12.5 kg or more, orally) or arginine (0.5 g/kg to a maximum of 40 g, intravenously). An x-ray of the left hand, including the wrist, was obtained for BA determination by two pediatric endocrinologists using the Greulich-Pyle method [11]. All participants underwent brain MRI to rule out intracranial lesions or to determine pituitary gland morphology. The patients were scanned on various 3.0 T MRI units (Discovery MR750/750, GE Healthcare [Chicago, IL, USA]; or Ingenia CX, Philips Medical Systems [Amsterdam, The Netherlands]). The imaging protocols included pre-contrast sagittal T1-weighted, sagittal T2-weighted, high-resolution coronal T2-weighted, and contrast-enhanced T1-weighted imaging (T1C). The sequence parameters of the high-resolution coronal T2-weighted images were: TR/TE=2447/80 msec, slice thickness=1.5 mm, intersection gap=0 mm, field of view=20 × 20 cm, and pixel spacing=0.391 × 0.391 mm. A radiology specialist measured the outermost boundaries of anteroposterior (AP) diameter and height of pituitary glands on midsagittal images, and the maximal horizontal diameter was measured on coronal images (Fig. 2). The PVs were calculated using the formula of an ellipsoid (V=[height × depth × width]/2). All measured values are calculated in SDS according to the normative data for pituitary diameters in a Turkish pediatric population [12].
All patients were administered the GH dose based on their body weight. The first treatment dose was 0.72 units/kg/wk for patients with GH deficiency and 0.75–0.9 units/kg/wk for those with ISS [13]. We adjusted the GH dose to maintain the IGF-1 level in the normal range for age (0 to +2 SD) [13]. Height SDS gains after the first year of GH treatment were also assessed. We defined a good response to GH treatment as a gain of 0.6 or more in height SDS in the first year of treatment [14].
3. Statistical analysis
All data are presented as number (%) or mean±standard deviation. Chi-square test was used for categorical variables, and the t-test was used to compare the means of the single variant analysis. Statistical significance was set at P-value < 0.05. Data analyses were performed using IBM SPSS Statistics ver. 20.0 (IBM Co., Armonk, NY, USA).
Results
1. Clinical characteristics and PV in patients with GH deficiency or ISS
In this study, 152 children participated, of which 105 were diagnosed with GH deficiency and 47 were diagnosed with ISS. Table 1 shows the clinical characteristics and PVs of patients with GH deficiency or ISS. There was no significant differences in sex and age at the start of treatment and no significant difference in MPH between the GH deficiency and ISS groups. Initial height SDS was substantially smaller in patients with ISS than in those with GH deficiency (P=0.001). IGFBP-3 level SDS in GH deficiency was lower than that in ISS (P<0.05), but IGF-I level SDS did not show a significant difference between groups (P=0.248). AP and horizontal diameter, the height of the pituitary gland, and PV SDS did not show differences between the GH deficiency and ISS groups (P=0.249, P=0.851, P=0.314, P=0.536, respectively).
2. Association between PV and severity of GH deficiency
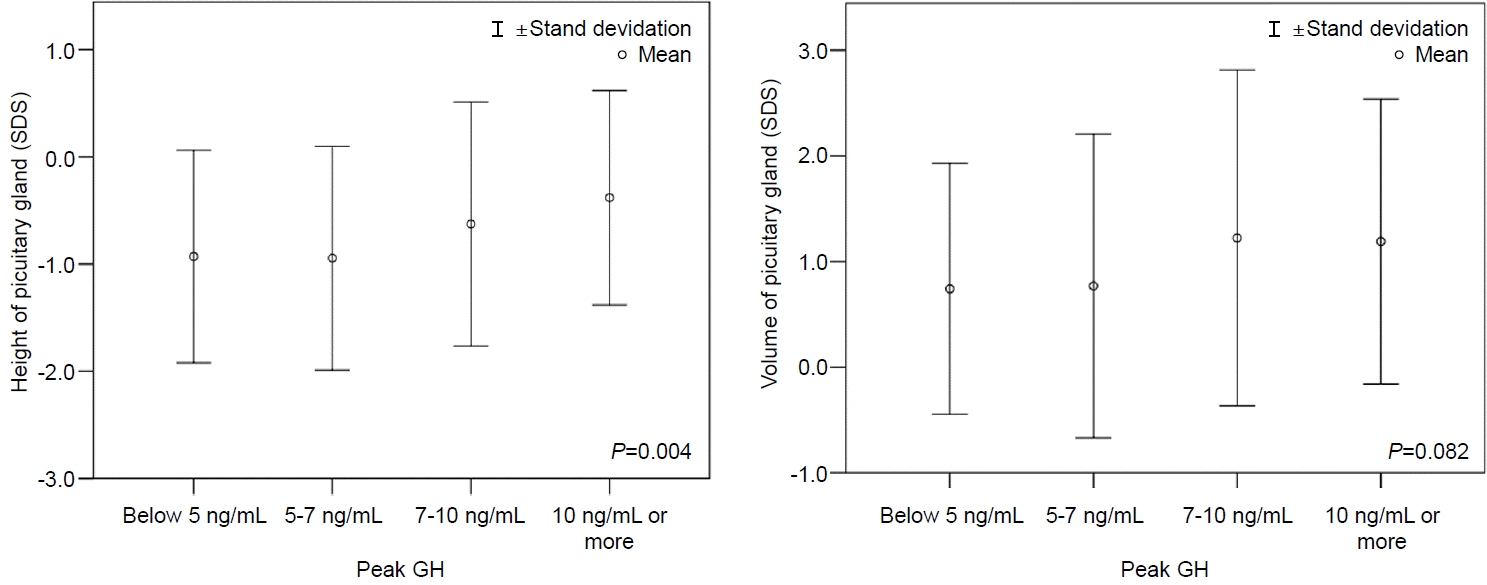
The PV SDS seemed to be smaller in the severe GH deficiency group than in the mild deficiency and ISS groups, although it was not significantly different (P=0.082). The height of the pituitary gland was associated with severity of GH deficiency (P<0.005) (Fig. 3).
3. Univariable analysis and multiple linear regression analyses between responsiveness to GH treatment and clinical factors
In patients with GH deficiency, PV was the only factor related to the treatment response. Initial height SDS, IGF1 level, and PV showed significant differences between the good and poor groups in univariable analysis (P<0.001, P=0.012, P=0.003, respectively). However, only PV was significant when multiple variable analysis was performed simultaneously (P=0.001) (Table 2). The association between PV and response to GH treatment was not consistent between GH deficiency patients and ISS patients. The PV was not significantly different between good and poor response groups in patients with ISS. The IGFBP3 level SDS was the only statistically correlated factor for responsiveness in univariable analysis (P<0.05). In multiple linear regression analysis, there was no correlation for responsiveness of initial height, IGF-1 level, or PV SDS in patients with ISS (P=0.879, P=0.252, P=0.086, respectively) (Table 3).
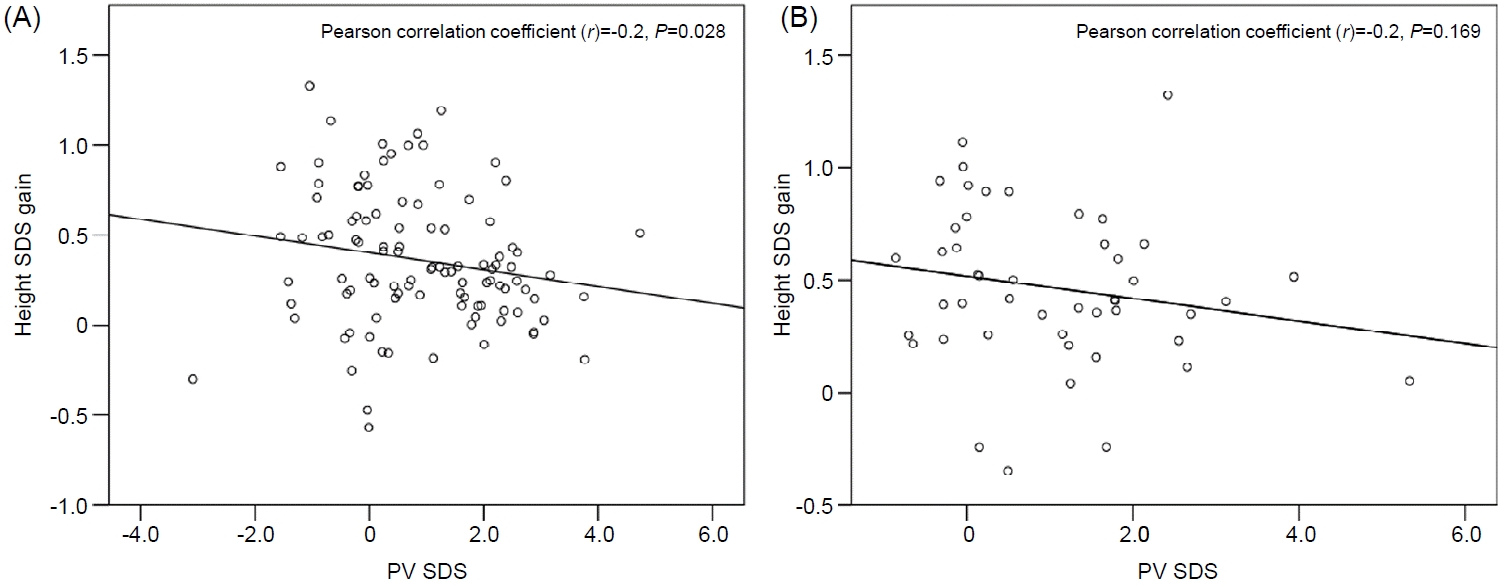
Pearson correlation analysis determined that a height SDS gain during the first year of GH treatment was statistically correlated with the PV SDS in patients with GH deficiency but not in ISS patients (Pearson correlation coefficient [r]=-0.2, P=0.028; Pearson correlation coefficient [r]=-0.2, P=0.169, respectively) (Fig. 4).
Discussion
Our data showed no difference in PV SDS between patients with GH deficiency and those with ISS. Since PV is associated with age, sex, and height, PV was calculated and evaluated by SDS to reduce the bias [12]. Patients with ISS had shorter heights before treatment than patients with GH deficiency; this may have offset the difference in PV. Moreover, an ISS diagnosis includes neurosecretory dysfunction in which there is an explosive surge of GH that is insufficient for cumulative secretion [15]. The PV may reflect the GH surge but not the cumulative secretory capacity. This hypothesis also explains the lack of association between PV and response to GH treatment in ISS. Some previous studies have shown that the anatomical abnormalities and size of the pituitary gland are related to the severity of GH deficiency. Arends et al. [5] showed anatomical abnormalities in the pituitary region in 58% of isolated GH deficiency cases. This contrasts with children without GH deficiency, such as those small for gestational age, who did not exhibit such abnormalities [5]. Anatomical abnormalities include ectopic neurohypophysis, interruption of the pituitary stalk, and empty sella [3,5,16]. Without structural abnormalities, Deeb et al. reported that the pituitary size is smaller in those with GH deficiency compared to those with normal height [6]. Another study has reported smaller PV in GH deficiency than in ISS patients [17]. That study compared the PV directly; this differed from our study in which we calculated the PV SDS.
The PV seemed smaller as the severity of GH deficiency increased, but the difference was not statistically significant (P=0.082). The height of the pituitary gland was associated with the severity of GH deficiency (P<0.005). This supports the hypothesis that the size of pituitary gland reflects the degree of GH surges confirmed by provocation test. In previous studies, height of the pituitary gland was the most impactful among factors determining pituitary gland volume [6,18]. The midsagittal height of the pituitary gland rather than PV may reflect more accurately the variations in pituitary morphology.
The PV in the good response group was smaller than that in poor response group in patients with GH deficiency (P<0.005) because PV may reflect the GH surge. Ariza Jiménez et al. [19] reported that patients with abnormal MRI findings show a more favorable response to GH treatment. Also, Khadilkar et al. [20] have reported that, in GH deficiency patients, smaller PV is associated with a better response to GH treatment. Nevertheless, PV showed no association with responsiveness to GH treatment in patients with ISS (P=0.073). This discrepancy could be due to factors other than GH deficiency; in those with short stature, many other factors may influence the GH treatment response, and the effect of these factors dilute that of the GH deficiency caused by PV.
When GH deficiency was diagnosed by provocation test, sella MRI was performed to determine the underlying causes. Based on the results of this study, the assessment of pituitary gland size may be helpful in predicting GH treatment response in patients with GH deficiency. However, this assessment is not suitable for delineating GH deficiency from ISS as the cause for short stature.
This study had several limitations. First, the PV SDS was calculated based on data from other races because there were no data on Koreans or Asians [12]. AP diameter SDS was larger than horizontal diameter SDS or height SDS based on data from Turkish children. Pituitary shape may vary between races. Second, since only the gain of height in the first year of treatment was evaluated, the long-term response needs to be analyzed. Last, height based on BA was not considered.
In summary, PV may be a good response predictor for GH treatment in patients with GH deficiency. However, in ISS, prediction of GH treatment response based on PV is difficult because factors other than GH insufficiency affect short stature.