Vitamin D deficiency is a public health emergency among Indonesian children and adolescents: a systematic review and meta-analysis of prevalence
Article information

Abstract
Purpose
This study aimed to describe the prevalence of vitamin D deficiency in Indonesian children and adolescents.
Methods
This was a meta-analysis of prevalence using the Hartung-Knapp-Sidik-Jonkman method with a random effects model. A prediction interval was used to estimate true effects. We searched PubMed, MEDLINE, Cochrane Library, Science Direct, Google Scholar, and 3 Indonesian databases (Indonesian Scientific Journal Database, Neliti, and Indonesia One Search). We included cross-sectional or case-control studies that provided data on the prevalence of vitamin D deficiency. We excluded case reports, case series, cohort studies, or studies outside Indonesia. We computed point prevalence by dividing the number of children with hypovitaminosis D by the total number of subjects in that study. This review was registered with PROSPERO (International Prospective Register of Systematic Reviews) (CRD42022329814).
Results
Of 1,397 manuscripts identified, 7 were included in this review. A total of 5,870 children were included in this meta-analysis, ranging in age from 6 months to 19 years. The prevalence of hypovitaminosis D in Indonesia was calculated as 33% (95% confidence interval [CI], 9–56) and was higher in females (60% [95% CI, 58–62]) than in males (40% [95% CI, 38–42]). Mean serum vitamin D level was 22.74 ng/mL (95% CI, 16.95–30.51) with a prediction interval of 15.96 ng/mL to 29.52 ng/mL.
Conclusions
Vitamin D deficiency is a public health emergency in Indonesia. Strategies to detect and treat vitamin D deficiency in Indonesian children and adolescents should be implemented immediately.
Highlights
· The prevalence of vitamin D deficiency amongst Indonesian children is lacking. Our meta-analysis found that the prevalence of hypovitaminosis D was 33% and was higher in females (60% vs. 40%). The mean serum vitamin D level was 22.74 ng/mL.
Introduction
Vitamin D affects the health of skeletal and extraskeletal organs and is a public health concern [1]. Vitamin D deficiency (hypovitaminosis D) has been found to cause rickets and is associated with psoriasis, muscle weakness, cardiomyopathy, increased risk of infections, autoimmune diseases, atopy, cancer, increased risk of cardiac-related deaths, obesity, diabetes, and metabolic syndrome [2-5]. During the pandemic, vitamin D gained attention as deficiency was associated with higher mortality in patients with severe coronavirus disease-19 [6,7].
Several studies have found that vitamin D deficiency is prevalent worldwide. Numerous epidemiological studies and reviews have concluded that vitamin D deficiency is not just a hype but a pandemic in itself [8,9]. In some countries, the government has taken corrective actions to rectify this problem, with successful outcomes in some parts of the world [10,11].
Certain populations are considered at higher risk of vitamin D deficiency than the general population, namely infants, children, pregnant women, and women of childbearing age, due to their increased metabolism and dietary need for vitamin D [12,13]. There is increasing evidence that vitamin D deficiency in childhood and adolescents contributes to noncommunicable diseases in adulthood [14].
Epidemiological data are lacking in Indonesia, with the most recent having been collected a decade ago and likely not reflecting Indonesia's current vitamin D status [15]. Reviews of vitamin D deficiency in Asia have not included Indonesian populations [16,17]. The lack of sound data hinders the government in identifying issues, determining the underlying causes, and designing policies to address identified issues [18].
Our primary goal in this systematic review and meta-analysis was to determine the prevalence of hypovitaminosis D in Indonesian children and adolescents. Our secondary aim was to determine mean vitamin D level and the prevalence of sufficient vitamin D level among Indonesian children and adolescents.
Materials and methods
1. Eligibility criteria
We adhered to the PRISMA (Preferred Reporting Items for Systematic Review) 2020 guidelines [19]. The protocol of this review was registered in the PROSPERO (International Prospective Register of Systematic Reviews) database with the registration number CRD42022329814.
The studied population comprised all children and adolescents (0–19 years old) with available serum 25-hydroxyvitamin D (25(OH)D) measurement. The primary outcome of this study was the point prevalence of hypovitaminosis D in Indonesia. Subgroup analyses were performed based on sex, study quality, method used to measure vitamin D, and risk of bias. The cutoff for vitamin D was based on the criteria set by the Indonesian Pediatric Society [20]: 30–100 ng/mL was considered normal; 21–29 ng/mL insufficient; <20 ng/mL deficient, and <5 ng/mL severely deficient. To ensure the uniformity of the data, we divided mean values in nanomoles per liter (nmol/L) by 2.5 to convert values into nanograms per milliliter (ng/mL). Therefore, we set the cutoff for vitamin D deficiency as <20 ng/mL or <50 nmol/L. However, after searching the literature, we realized that some studies utilized different cutoffs. Hence, according to respective study cutoff, we classified subjects into 2 categories based on vitamin D status: hypovitaminosis (insufficient and deficient) or sufficient. We also performed a post hoc subgroup analysis based on our initial cutoff (>50 ng/mL as a normal vitamin D level). Initially, subgroup analyses of prevalence based on dwelling type, city, and skin type were planned. However, due to the limited data available for these subgroups, these results are reported qualitatively. A secondary outcome of this study was mean serum 25(OH)D level and prevalence of sufficient serum 25(OH)D in Indonesian children. There were no intervention or comparator groups.
Inclusion criteria were cross-sectional studies published in English or an Indonesian language. For case-control studies, we chose the control (normal) groups. We did not include neonates as their serum 25(OH)D levels are primarily influenced by their mothers [21]. We included gray literature such as conference abstracts, theses, and dissertations. Exclusion criteria were case reports, case series, cohort studies, reviews, animal studies, and studies performed outside of Indonesia. Children with comorbidities or those who were acutely ill at the time of the study were excluded. We also excluded studies with fewer than 50 samples [22]. To ensure literature saturation, citations were collected from review studies. We also performed citation and hand searching to ensure that all available studies were included.
2. Search strategy and study selection
The literature search was initiated on 29th April 2022 and ended the same day. We searched 5 academic databases: PubMed, MEDLINE, Cochrane Library, Science Direct, and Google Scholar. Three Indonesian databases were also utilized to increase literature saturation: the Indonesian Scientific Journal Database, Neliti, and Indonesia One Search. Keywords used were related to epidemiology ("epidemiology," "prevalence"), vitamin D ("vitamin D deficiency," "hypovitaminosis D," "vitamin D insufficiency," "ergocalciferol," "25-hydroxyvitamin D," "calcifediol," "cholecalciferol"), age ("adolescent," "pediatric," "child," "infant"), and Indonesia ("Indonesia," "Nanggroe Aceh Darussalam," "Sumatera Utara," "Sumatera Selatan," "Sumatera Barat," "Bengkulu," "Riau," "Kepulauan Riau," "Jambi," "Lampung," "Bangka Belitung," "Kalimantan Barat," "Kalimantan Timur," "Kalimantan Selatan," "Kalimantan Tengah," "Kalimantan Utara," "Banten," "DKI Jakarta," "Jawa Barat," "Jawa Tengah," "DI Yogyakarta," "Jawa timur," "Bali," "Nusa Tenggara Timur," "Nusa Tenggara Barat," "Gorontalo," "Sulawesi Barat," "Sulawesi Tengah," "Sulawesi Utara," "Sulawesi Tenggara," "Sulawesi Selatan," "Maluku Utara," "Maluku," "Papua Barat," "Papua"). Medical Subject Heading (MeSH) terms for each database are presented in Supplementary Table 1. All records were entered into Rayyan software, which automatically recognizes duplicates [23]. This software also allows authors to collaborate in selecting relevant studies. Two independent authors (AS and MM) conducted the initial search and imported all findings into Rayyan. Another author (GSO) cross-checked the initial searches. These 3 authors independently screened all available studies. Conflicts were resolved by discussion with an expert (AH). In studies with overlapping time points, we chose the data that provided the largest amount of available information.
3. Data extraction and quality assessment
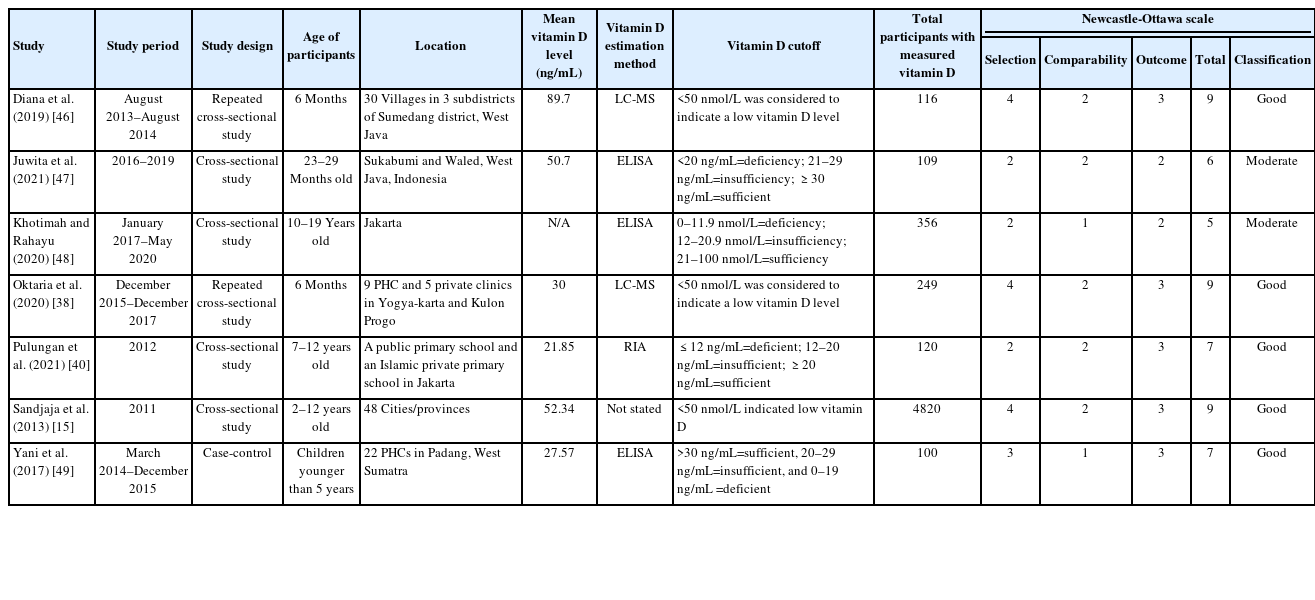
Data extraction was carried out independently by 1 author (GSO) and then reviewed by 2 authors (AS and MM) to ensure accuracy. We extracted relevant information of study identification (author and year of publication), study characteristics (location, study design, age of participants, and study period), and vitamin D-related information (vitamin D estimation method, mean level of vitamin D, vitamin D cutoff, and total participants).
The Newcastle-Ottawa scale (NOS) for cross-sectional studies was implemented to assess the quality of the studies. A score of 7–9 on the NOS implies a good quality study, 4–6 indicates a moderate or fair quality study, and a score of 0–3 indicates a poor quality study [24]. To assess the risk of bias, we used Joanna Briggs' Institute criteria for prevalence studies. Studies with a score of 0–3 were considered to have low risk of bias, those with a score of 4–6 were considered to have moderate risk of bias, and those with a score of 7–9 were considered to have a high risk of bias [25]. Three reviewers (GSO, AS, MM) independently assessed the scales, and any discrepancies were discussed with the expert (AH) until a consensus was attained. Missing or insufficient data were requested from the appropriate corresponding author, but none was obtained.
4. Data synthesis
We computed point prevalence by dividing the number of children with hypovitaminosis D by the total number of subjects in that study [26]. We used prediction intervals to assess heterogeneity [27], and between-study heterogeneity was explored with a Galbraith plot [28]. Publication bias was assessed with funnel plot analysis for more than 10 studies [29], Begg and Mazumdar's test was used for rank correlation [30], and Egger test was used to calculate the regression intercept [31]. Trim-and-fill analysis was planned for identification of asymmetry in the funnel plot [32]. Analyses were executed in Stata 17.0 (StataCorp., College Station, TX, USA) using the metaprop command [33], and results were displayed using forest plots.
Results
We identified 1,397 manuscripts, 114 of which were dupli cates. A total of 1,206 records was eliminated after assessment of the titles and abstract, and 77 articles were subjected to a full assessment. A total of 6 articles was included in the final analysis. Fourteen additional articles were collected through citation and hand searching, one of which was included in our meta-analysis [15]. Notable exclusions included one study that did not specify the vitamin D cutoff [34], one study that included Dutch residents of Indonesian ethnicity [35], 2 studies [36,37] generated from the same dataset [38], one poster presentation [39] that was published as a full paper [40], and 5 studies [41-45] that were part of the Southeast Asian Nutrition Surveys (SEANUTS) study [15]. Therefore, 7 studies [15,38,40,46-49] were subjected to systematic re vie w and meta-analysis (Supplementary Fig. 1). The characteristics of the studies and Newcastle-Ottawa scale scores are presented in Table 1, while the risk of bias of each study is presented in Supplementary Table 2.
Characteristics of the included studies
A total of 5,870 children was included in this meta-analysis, ranging in age from 6 months to 19 years. The overall study period covered 2011–2020, during which the prevalence of hypovitaminosis D in Indonesia was 33% (95% confidence interval [CI], 9–56; I2 =99.76%, P<0.01) (Fig. 1). The Galbraith plot indicated no heterogeneity (Supplementary Fig. 2A). Begg and Mazumdar test for rank correlation gave a P-value of <0.001, indicating possible publication bias. Egger test for a regression intercept yielded a P-value of 0.0027, also indicating possible publication bias.
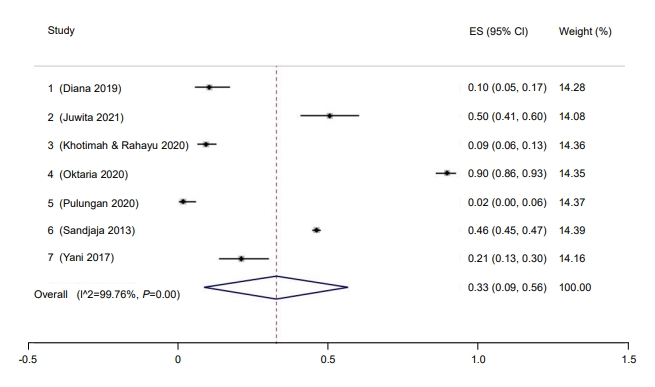
Prevalence of pediatric vitamin D deficiency in Indonesia. ES, effect size; CI, confidence interval.
Subgroup analysis was performed for study quality, the method used to measure vitamin D, and risk of bias. Prevalence rate was higher among studies with a low risk of bias (37%; 95% CI, 9–64) compared to those with a moderate risk of bias (9%; 95% CI, 6–13) (Fig. 2). Five studies had a low risk of bias, while one study had moderate bias. Good quality studies reported higher prevalence rates of hypovitaminosis D (34%; 95% CI, 4–6) than moderate quality studies (13%; 95% CI, 10–16) (Fig. 3). Last, studies that used liquid chromatography-tandem mass spectroscopy (LC-MS) reported a higher prevalence rate (69%; 95% CI, 67–72) than studies that used a non-LC-MS method (26%; 95% CI, 2–49) to measure serum vitamin D (Fig. 4). The prevalence of hypovitaminosis D in studies that used 50 ng/mL as their cutoff was 49% (95% CI, 20–79), compared to 10% (95% CI, 2–18) in studies that used 30 ng/mL as their cutoff (Fig. 5).

Prevalence of pediatric vitamin D deficiency in Indonesia according to risk of bias. ES, effect size; CI, confidence interval.
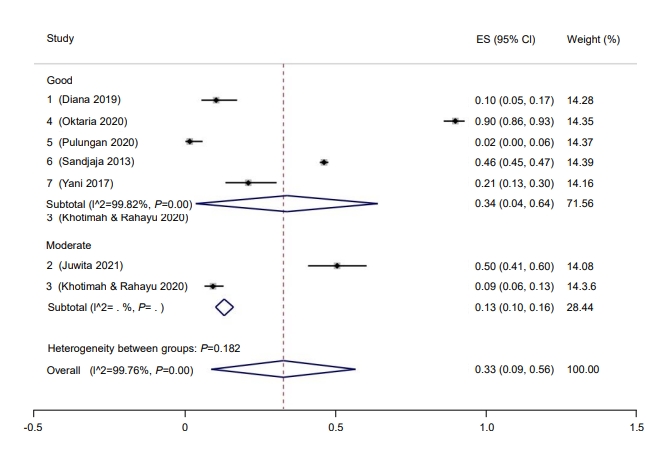
Prevalence of pediatric vitamin D deficiency in Indonesia according to study quality. ES, effect size; CI, confidence interval.

Prevalence of pediatric vitamin D deficiency in Indonesia according to machines used. ES, effect size; CI, confidence interval.
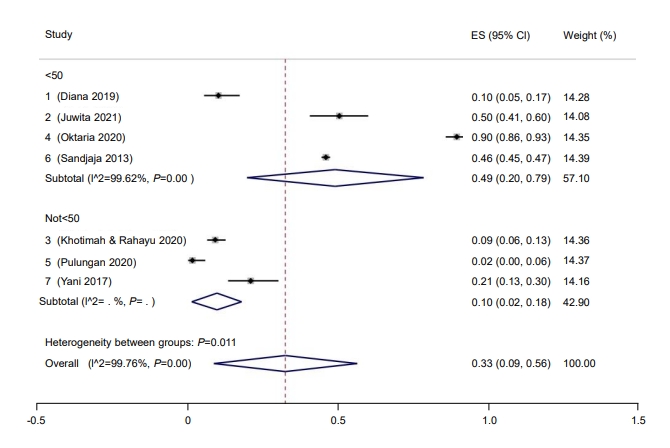
Prevalence of pediatric vitamin D deficiency in Indonesia according to cutoff. ES, effect size; CI, confidence interval.
Three studies provided sufficient data to analyze the prevalence of hypovitaminosis D by sex. The prevalence rate for hypovitaminosis D in females (60%; 95% CI, 58–62; I2=0%, P=0.48) (Fig. 6) was higher than in males (40%; 95% CI, 38–42; I2=0%, P=0.48) (Fig. 7). The Galbraith plot indicated no heterogeneity in either sex (Supplementary Figs. 2B, C). For the female subgroup, Begg and Mazumdar test for rank correlation gave a P-value of 0.29, indicating no publication bias, consistent with the P-value of 0.61 for the regression intercept obtained from Egger test. Similarly, neither Begg and Mazumdar test for rank correlation (P=0.29) nor Egger test for a regression intercept (P=0.51) indicated the presence of publication bias.

Prevalence of male pediatric vitamin D deficiency in Indonesia. ES, effect size; CI, confidence interval.

Prevalence of female pediatric vitamin D deficiency in Indonesia. ES, effect size; CI, confidence interval.
Six studies provided sufficient data to calculate mean vitamin D level among Indonesian children and adolescents. Collectively, the mean serum vitamin D level was 22.74 ng/ml (95% CI, 16.95–30.51 ng/mL), and the prediction interval was 15.96 ng/mL to 29.52 ng/mL. The Galbraith plot indicated no heterogeneity (Supplementary Fig. 3). Begg and Mazumdar test for rank correlation provided a P-value of 0.0085, indicating possible publication bias. Egger test returned a regression intercept with a P-value of 0.0003, indicating possible publication bias. When further categorized by LC-MS use, studies that used LC-MS reported lower mean vitamin D level (21.32; 95% CI, 7.56–60.15) than studies that used non-LC-MS methods (22.80; 95% CI, 18.33–28.34).
Only 37% of children in Indonesia had a sufficient vitamin D level (95% CI, 17–57) (Fig. 8). The Galbraith plot indicated no heterogeneity (Supplementary Fig. 4A). Begg and Mazumdar test for rank correlation gave a P-value of 0.0085, indicating possible publication bias. Egger test for a regression intercept resulted in a P-value of <0.0001, also indicating possible publication bias. The prevalence of sufficient vitamin D levels was higher in males at 54% (95% CI, 44–63; I2=83.76%; P<0.01) (Fig. 9) than females at 46% (95% CI, 37–56; I2=83.76%; P<0.01) (Fig. 10). The Galbraith plot for males indicated no heterogeneity (Supplementary Fig. 4B). Begg and Mazumdar test for rank correlation yielded a P-value of 0.296, indicating no evidence of publication bias. Egger test for a regression intercept yielded a P-value of 0.035, indicating possible publication bias. The Galbraith plot for females indicated no heterogeneity (Supplementary Fig. 4C). Begg and Mazumdar test for rank correlation gave a P-value of 0.296, indicating no evidence of publication bias, while Egger test for a regression intercept yielded a P-value of 0.028, indicating possible publication bias.

Prevalence of children and adolescent with sufficient vitamin D in Indonesia. ES, effect size; CI, confidence interval.

Prevalence of male children and adolescent with sufficient vitamin D in Indonesia. ES, effect size; CI, confidence interval.

Prevalence of female children and adolescent with sufficient vitamin D in Indonesia. ES, effect size; CI, confidence interval.
Discussion
Roth et al. [3] stated that a high prevalence of vitamin D deficiency was incidence in >20% of the population of a country. Based on this threshold, Indonesian children and adolescents have a high prevalence rate of hypovitaminosis D at 33%. According to the National Statistics Bureau of Indonesia, there were 88,385 children and adolescents aged 0–19 years in 2021 [50]. Based on the calculated numbers, 29,167 Indonesian children are currently suffering from hypovitaminosis D. This rate is higher than that of adolescent girls in India (25.7%) [51], African children (10.55%) [52], and European children (4%–7%) [9] but lower than rates reported for children in Afghanistan (96.2%) and Pakistan (94%) [16]. The most recent systematic review of the prevalence of vitamin D deficiency among 5 Southeast Asian countries (Thailand, Indonesia, Vietnam, Malaysia, and Cambodia) reported a prevalence range from 0.9% to 96.4% [53]. However, almost all studies conducted to date have implemented different vitamin D cutoffs to determine the prevalence of hypovitaminosis D, complicating direct comparison. The CI for hypovitaminosis D prevalence in this study was 9%, which indicates a true prevalence rate less than 20%.
When compared by sex, females (60%) had a higher prevalence rate of hypovitaminosis D than males (40%). This indicates that 18,146 of the 45,366 male children and adolescents in Indonesia currently suffer from hypovitaminosis D, along with 25,811 of 43,018 young females [50]. Other studies have confirmed this phenomenon [16,54], with one study of an Islamic public school reporting that females had a higher prevalence of vitamin D deficiency than males [40]. One possible explanation for this is that Southeast Asian females wear traditional heavy clothing such as hijabs, which protect the skin from ultraviolet (UV) light [55]. Furthermore, Asian females are concerned about sun exposure and will intentionally avoid or protect themselves from it [17,56]. Other factors that likely contribute to the high prevalence of hypovitaminosis D in Indonesian children and adolescents are malnutrition and darker skin type [38,40,46].
A narrative review was conducted for all factors that could not be synthesized quantitatively. Only 2 studies assessed the effect of Fitzpatrick skin type on vitamin D deficiency [38,40]. Pulungan et al. [40] found that students with Fitzpatrick skin type IV were more likely to have sufficient vitamin D (83.2%) level than nonsufficient vitamin D level (68.1%), although this association was not significant. They also found that more prolonged sun exposure was significantly associated with a sufficient vitamin D level. Wearing long sleeves or skirts did not significantly affect vitamin D sufficiency. However, Oktaria et al. [38] found that infants with Fitzpatrick skin type III and IV had a significantly lower risk of hypovitaminosis D compared to infants with Fitzpatrick skin type II. They also found that prolonged weak sun exposure was an independent and significant risk factor for low vitamin D level in infants.
The prevalence rate of hypovitaminosis D found in this meta-analysis was higher in studies categorized with a low risk of bias and of good quality. While this finding contradicts the importance of selecting only high-quality and appropriate studies for quantitative assessment [57], our metanalysis included only one study with a moderate risk of bias. Our rationalization for subgrouping the prevalence of vitamin D deficiency based on the method used for measurement is that LC-MS has been touted as the "reference standard" [58]. In nearly the same number of studies in each arm (LC-MS vs. non-LC-MS), the prevalence of hypovitaminosis D in the LC-MS arm was almost 3 times as high as that in the non-LC-MS group. This finding signifies the importance of appropriate measurement tools in studies that heavily rely on measurement accuracy, reliability, and validity.
According to the Indonesian Pediatric Society vitamin D cutoff value, Indonesian children and adolescents have insufficient serum vitamin D levels [20]. When assessed according to the predetermined cutoff of 50 ng/mL, the prevalence of hypovitaminosis D was higher than that reported in studies that used a different cutoff. However, this subgroup analysis was performed post hoc, and only 2 studies adhered to this cutoff. Therefore, any interpretations should be considered observational, at best [59]. Mean vitamin D level was higher than the pooled serum vitamin D level reported for South Asian children and adolescents (19.15 ng/mL) [16] but lower than that reported for African children (28.88 ng/mL) [52]. Numerous factors affect serum vitamin D level besides those mentioned previously, such as dietary and vitamin D supplement intake [10], body mass index, physical activity [60], genetic influences [61,62], and infection status [63]. Studies that have used LC-MS have reported a lower mean of serum vitamin D than studies that used non-LC-MS methods. The Vitamin D Standardization Program found widely different prevalence rates of hypovitaminosis D when comparing studies that used unstandardized LC-MS [9].
Less than half of Indonesian children and adolescents have adequate serum vitamin D level. The prevalence rate was likely worse for female children and adolescents than males for the reasons outlined earlier. The high prevalence rate of hypovitaminosis D and low prevalence rate of vitamin D sufficiency pose a problem for women, especially pregnant women, as low serum vitamin D can affect neonates' anthropometrical and neurodevelopmental characteristics [21,64,65].
Our meta-analysis suffers from several limitations. The lack of uniform vitamin D cutoffs has been mentioned as a limitation in numerous previous studies [2,66,67]. We resorted to roughly separating individuals based on self-tested vitamin D level into "normal" and "subnormal" subgroups as many studies did not provide sufficient information to classify the study subjects more robustly. The difficulty in classifying vitamin D levels may explain the wide CI in the prevalence of hypovitaminosis D. However, we feel this rough classification is justified as different guidelines have proposed different cutoffs with particular concerns in mind such as optimal values for skeletal health compared to extraskeletal benefits. We also were unable to perform subgroup meta-analyses based on weather, region, nutritional status, skin type, activities, UV index, dietary and supplement intake, or air pollution index due to differences in how and what data were reported among studies. Some of the included studies did not specify the exact location of their research [15,48], but only one study was conducted outside of Java [49]. Another concern is publication bias. Although the Galbraith plot indicated no publication bias for our meta-analysis, Begg and Egger tests indicated publication bias for all findings except prevalence of hypovitaminosis D in male and female subgroups. However, we searched the literature extensively, including gray abstracts. Therefore, it is possible that unpublished studies exist or that studies that included fewer than 50 participants contributed to this publication bias. We did not utilize the traditional I2 proportion to measure heterogeneity because it does not disclose genuine effect size dispersion [68]. Furthermore, because Cochran Q test is only utilized in conjunction with the DerSimonian-Laird technique, we did not implement this test [69]. Our method of reporting heterogeneity by presenting the prediction interval, however, conveys the true prevalence rate [27].
Strengths of our meta-analysis include that this is the first meta-analysis to measure the hypovitaminosis D prevalence rate in Indonesian children and adolescents. We agree with Cashman that a proper estimate is best derived from nationally representative population-based surveys [70]. The study by Sandjaja et al. [15], which was part of the SEANUTS study, fits this description. However, this study is over a decade old and only sampled 0.009% of the total population. It also did not include children younger than 2 years or older than 12 years, making our meta-analysis more comprehensive with regard to age range. Although our meta-analysis has shortcomings, the information can be used to guide Indonesian government, policymakers, healthcare professionals, and other stakeholders to plan strategies to address the high prevalence of hypovitaminosis D in Indonesia children.
In conclusion, with a prevalence rate of 33%, hypovitaminosis D is a public he alth issue in Indonesi an children and adolescents. More females (60%) than males (40%) suffer from hypovitaminosis D and both these groups are at high risk due to the impact of hypovitaminosis D on growth. Lack of treatment of hypovitaminosis D in childhood may result in potentially lethal and disabling chronic diseases in adulthood that significantly burden individuals and the nation.
To ensure uniformity among studies, there needs to be a better guiding consensus to determine the appropriate vitamin D cutoff level. We suggest using the Indonesian Pediatric Society's cutoff as it is based on local consensus. Publicly accessed, deidentified data need to be made available as well to ensure better data transparency and accessibility. A large population-based study that takes into consideration the phenotype and genotype, latitude and sun exposure, dietary intake and habits, and other relevant factors of Indonesian children and adolescents is urgently needed.
Interventions are required to address the high prevalence of hypovitaminosis D. While supplementation may solve this issue temporarily, it may not be the best approach in Indonesia until further confirmatory studies are done. Dose adjustment of vitamin D supplementation and lifestyle modifications may be important for correcting the significant prevalence of hypovitaminosis D in Indonesia.
Supplementary Materials
Supplementary Tables 1-2 and Figs. 1-4 can be found via https://doi.org/10.6065/apem.2244170.085.
Supplementary Table 1.
Medical subject heading (MeSH) terms and keywords used in each database
Supplementary Table 2.
Assessment of risk of bias using Joanna Briggs Institute (JBI) Checklist
Supplementary Fig. 1.
PRISMA flowchart for selection of included studies
Supplementary Fig. 2.
Galbraith plot of the prevalence of overall hypovitaminosis (A), in the male population (B), and female population (C). CI. confidence interval.
Supplementary Fig. 3.
Galbraith plot of the mean vitamin D level. CI. confidence interval.
Supplementary Fig. 4.
Galbraith plot for the prevalence of overall sufficient vitamin D level (A), in the male population (B), and female population (C). CI. confidence interval.
Notes
Conflicts of interest
No potential conflict of interest relevant to this article was reported.
Funding
This study received no specific grant from any funding agency in the public, commercial, or not-for-profit sectors.
Data availability
The data that support the findings of this study can be provided by the corresponding author upon reasonable request.
Author contribution
Conceptualization: GSO; Data curation: GSO, AS, AH; Formal analysis: GSO, AS, MM, AH; Funding acquisition: GSO; Methodology: GSO, AS, MM; Project administration: GSO, AH; Visualization: GSO; Writing - original draft: GSO, AS, MM, AH; Writing - review & editing: GSO, AS, MM, AH