 |
 |
- Search
| Ann Pediatr Endocrinol Metab > Volume 28(2); 2023 > Article |
|
Abstract
Purpose
Methods
Results
Notes
ACKNOWLEDGMENTS
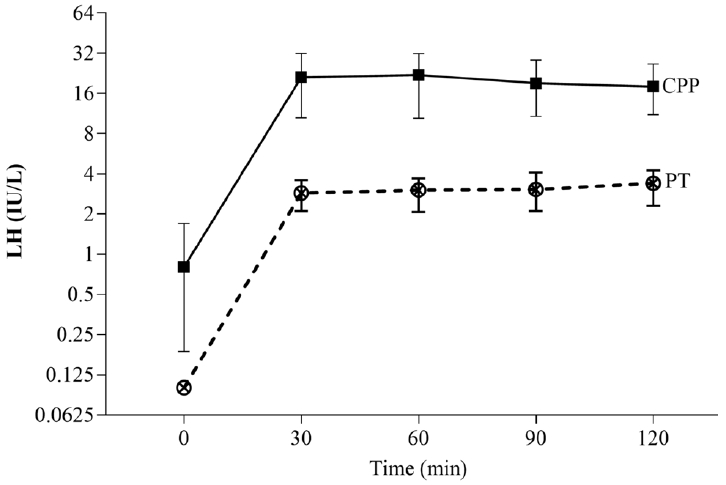
Fig.┬Ā1.

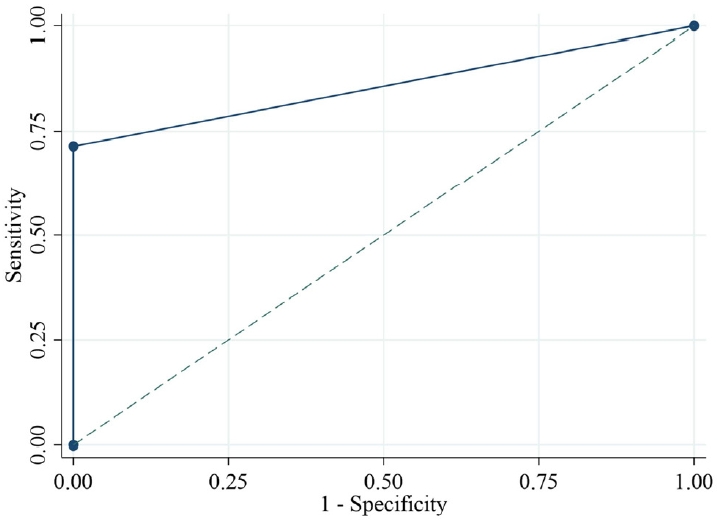
Fig.┬Ā2.

Fig.┬Ā3.

Table┬Ā1.
| Variable | CPP (N=56) | PT (N=30) | P-value |
|---|---|---|---|
| Age (yr) | 7.8 (7.4ŌĆō8.3) | 7.5 (7.2ŌĆō7.9) | 0.04* |
| Age of onset of breast development (yr) | 7.3 (7ŌĆō7.5) | 7.2 (6.6ŌĆō7.5) | 0.30 |
| BW (SDS) | 0.7 (0.3ŌĆō1.4) | 0.9 (0.3ŌĆō2.1) | 0.50 |
| Height (SDS) | 1 (0.4ŌĆō1.7) | 0.5 (0.1ŌĆō1.8) | 0.21 |
| BMI (SDS) | 0.3 (-0.5 to 1.2) | 0.7 (0 to 2.4) | 0.09 |
| BA (yr) | 8.8 (8ŌĆō11) | 7.8 (6.8ŌĆō8.3) | <0.001* |
| BA/CA ratio | 1.2 (1.1ŌĆō1.3) | 1 (0.9ŌĆō1.1) | <0.001* |
| BA-CA (yr) | 1.3 (0.7ŌĆō2.2) | 0.1 (-0.6 to 0.7) | <0.001* |
Values are presented as median (interquartile range).
Differences in continuous variables were identified between the 2 groups using a Wilcoxon rank-sum test. Differences in categorical variables were investigated using a chi-square test.
BA, bone age; CPP, central precocious puberty; PT, premature thelarche; BW, body weight; SDS, standard deviation score; BMI, body mass index; CA, chronological age.
Table┬Ā2.
| Variable | Cutoff | Sensitivity (95% CI) | Specificity (95% CI) | PPV (95% CI) | NPV (95% CI) | ROC area (95% CI) | P-value |
|---|---|---|---|---|---|---|---|
| Basal LH (IU/L) | >0.1 | 76.8 (63.6ŌĆō87) | 90 (73.5ŌĆō97.9) | 93.5 (82.1ŌĆō98.6) | 67.5 (50.9ŌĆō81.4) | 0.834 (0.756ŌĆō0.912) | <0.001* |
| Basal LH (IU/L) | >0.3 | 73.2 (59.7ŌĆō84.2) | 100 (88.4ŌĆō100) | 100 (91.4ŌĆō100) | 66.7 (51ŌĆō80) | 0.866 (0.808ŌĆō0.925) | <0.001* |
| LH (IU/L) at 30 min | >6 | 92.9 (82.7ŌĆō98) | 100 (88.4ŌĆō100) | 100 (93.2ŌĆō100) | 88.2 (72.5ŌĆō96.7) | 0.964 (0.93ŌĆō0.998) | <0.001* |
| LH (IU/L) at 60 min | >6 | 94.6 (85.1ŌĆō98.9) | 100 (88.4ŌĆō100) | 100 (93.3ŌĆō100) | 90.9 (75.7ŌĆō98.1) | 0.973 (0.943ŌĆō1) | <0.001* |
| LH (IU/L) at 90 min | >6 | 94.6 (85.1ŌĆō98.9) | 93.3 (77.9ŌĆō99.2) | 96.4 (87.5ŌĆō99.6) | 90.3 (74.2ŌĆō98) | 0.94 (0.886ŌĆō0.994) | <0.001* |
| LH (IU/L) at 120 min | >6 | 94.6 (85.1ŌĆō98.9) | 96.7 (82.8ŌĆō99.9) | 98.1 (90.1ŌĆō100) | 90.6 (75ŌĆō98) | 0.957 (0.912ŌĆō1) | <0.001* |
| Peak LH (IU/L) | >7 | 94.6 (85.1ŌĆō98.9) | 100 (88.4ŌĆō100) | 100 (93.3ŌĆō100) | 90.9 (75.7ŌĆō98.1) | 0.973 (0.943ŌĆō1) | <0.001* |
| Basal LH/FSH | >0.1 | 75 (61.6ŌĆō85.6) | 80 (61.4ŌĆō92.3) | 87.5 (74.8ŌĆō95.3) | 63.2 (46ŌĆō78.2) | 0.775 (0.682ŌĆō0.868) | <0.001* |
| Peak LH/FSH | >0.5 | 87.5 (75.9ŌĆō94.8) | 100 (88.4ŌĆō100) | 100 (92.7ŌĆō100) | 81.1 (64.8ŌĆō92) | 0.938 (0.894ŌĆō0.981) | <0.001* |
| Basal LH > 0.2 IU/L and basal LH/FSH Ōēź 0.1 | - | 71.4 (57.8ŌĆō82.7) | 100 (88.4ŌĆō100) | 100 (91.2ŌĆō100) | 65.2 (49.8ŌĆō78.6) | 0.86 (0.8ŌĆō0.92) | <0.001* |
A receiver operating characteristic (ROC) curve was created to determine the optimal cutoff value of LH to serve as the primary endpoint.
P-values were performed by chi-square test.
GnRH, gonadotropin-releasing hormone; CPP, central precocious puberty; CI, confidence interval; PPV, positive predictive value; NPV, negative predictive value; LH, luteinizing hormone; FSH, follicle-stimulating hormone.


