


Highlights
¡ Using 2009-2011 Korea National Health and Nutrition Examination Survey, this study establishes percentage of appendicular skeletal muscle mass (PASM) references for adolescents and reveals that low PASM is associated with increased risks of metabolic syndrome and insulin resistance, emphasizing the need for regular body composition monitoring.
Introduction
The prevalence of metabolic syndrome (MS) is increasing worldwide [1]. MS in adolescents can persist into adulthood and predispose the individual to cardiovascular disease and type 2 diabetes 25â30 years after onset [2]. Therefore, early detection and management of MS are essential. Insulin resistance (IR) is regarded as a primary etiology of MS but is not included in its definition [3].
Skeletal muscle plays an essential role in lipid and protein metabolism and insulin-mediated glucose utilization [4]. Appendicular skeletal muscle mass (ASM) is a highly reliable predictor of total body skeletal muscle mass [5]. ASM refers to the mass of the extremities after subtracting fat and bone mass [6]. Dual-energy x-ray absorptiometry (DXA) is a simple and quick method to evaluate body composition, including skeletal muscle mass, for estimating ASM [7]. ASM adjusted by weight (percentage of ASM [PASM]) is commonly used because unadjusted ASM increases with weight and height.
Recently, the importance of ASM on metabolic health has emerged. A negative correlation between sarcopenia and metabolic health has been reported in adults [8-10]. There is a growing interest in the relationship between low muscle mass and metabolic risk in the pediatric population [11-13]. IR increases with low skeletal muscle mass, elevating the risk of metabolic disorders [14]. However, there are no reference values for PASM of Korean adolescents computed using nationally representative population-based data.
In this study, reference values of PASM were generated for Korean adolescents aged between 10 and 18 years utilizing the LMS (lambda for the skew, mu for the median, and sigma for the generalized coefficient of variation) method [15]. We further investigated the links between PASM, IR, and MS in adolescents.
Materials and methods
1. Study population
Data from the Korea National Health and Nutrition Examination Survey (KNHANES) performed between 2009 and 2011 were used. KNHANES is a cross-sectional, nationally representative study carried out by the Division of Chronic Disease Surveillance, Korea Centers for Disease Control and Prevention. Subjects were selected via proportionate allocation using multistage stratification for systematic sampling. The specific methods for collecting KNHANES data have been reported elsewhere [16].
The study population is outlined in detail in Supplementary Fig. 1. Subjects of this study ranged in age from 10 to 18 years (n=4,598). Those who did not have DXA values (n=2,679) or had an underlying disease (n=13) were excluded from the analysis.
Additionally, subjects with extreme anthropometric parameters (n=384) were removed prior to reference value computation. Extreme anthropometric parameters were defined as height and weight that were below the third percentile or above the 97th percentile for the subject's age and sex according to the 2017 Korean National Growth Chart [17]. The ASM reference value was produced using 1,522 subjects.
Using the reference value, we investigated the association between PASM and MS in adolescents. The study excluded subjects missing either laboratory results (n=527) or household income and daily energy intake data (n=185). Those who had a fasting time prior to blood samples of less than 8 hours (n=20) were also excluded. The remaining overall sample consisted of 1,174 subjects.
2. ASM indices
DXA examination was conducted using a QDR Discovery fan beam densitometer (QDR4500A; Hologic, Inc., Bedford, MA, USA). Body composition data as measured by DXA included lean mass, fat mass (FM, g), and bone mineral content (BMC, g). ASM was calculated by deducting FM and BMC from the total mass of arms and legs [5]. PASM was measured using this formula: PASM=[ASM (kg)/weight (kg)Ă100 (%)] [5,18].
3. Anthropometric and biochemical assessments
Each participant's medical information was acquired by skilled investigators. All participants underwent physical examinations measuring height (cm) by stadiometer (Seca 225, Seca, Hamburg, Germany) and weight (kg) by an electronic balance (GL-6000-20, G-tech, Seoul, Korea). Body mass index (BMI) was defined as weight (kg) divided by height squared (kg/m2). The z-scores of height, weight, and BMI was calculated after transforming relative to the standard values described in the 2017 Korean National Growth Chart [17]. The waist circumference (WC) was measured at the midpoint between the lower margin of the last palpable rib and the top of the iliac crest during expiration using a flexible tape (Seca 220, Seca). The z-score of WC was produced by transforming a subject's WC relative to the reference values acquired from KNHANES 2007-2019 [19]. Blood pressure (BP) was evaluated by a mercury sphygmomanometer (Baumanometer, W.A. Baum Co., Copiague, NY, USA) after the participant had rested in a sitting position for at least 5 minutes. BP was estimated on the right arm 3 times, and the mean value of the last 2 measurements was used in the analysis. Blood samples were obtained by experienced medical personnel and delivered to the central laboratory (NEODIN Medical Institute, Seoul, Korea) for measurement. Using the Hitachi Autonomic Analyzer 7600 (Hitachi Ltd., Tokyo, Japan), total cholesterol, serum triglycerides, high-density lipoprotein cholesterol (HDL-C), and fasting plasma glucose (FPG) were assessed by enzymatic analysis. Insulin level was determined by 1470 WIZARD gamma-Counter (PerkinElmer, Turku, Finland). The monthly household income of each subject was categorized into quintiles. Dietitians with training conducted a survey of dietary habit, 24-hour recall, and food frequency questionnaires. The Korean Foods and Nutrients Database of the Rural Development Administration was used to calculate daily energy intake.
4. MS and IR
In children, the diagnostic criteria for MS vary by sex, age, and race. In this study, the modified National Cholesterol Education Program - Third Adult Treatment Panel (modified NCEP-ATP III) criteria were used [20]. Each component of MS was defined. The presence of abdominal obesity equated to WC ⼠the 90th percentile for the corresponding subject age and sex based on the Korean national growth chart. High BP was defined as BP ⼠the 90th percentile for the corresponding height, age, and sex; and elevated FPG was FPG ⼠110 mg/dL. Elevated triglyceride was level âĽ110 mg/dL, and low HDL-C was <40 mg/dL [17,21]. Subjects were classified as having MS if 3 or more criteria were satisfied.
Pediatric simple MS score (PsiMS), a continuous variable, was obtained to quantify MS risk [22,23]. This formula was used to calculate the PsiMS: PsiMS=[2ĂWC (cm)/height (cm) + FPG (mg/dL)/100 + triglycerides (mg/dL)/150 + systolic BP (mmHg)/130 â HDL-C (mg/dL)/40] [24].
IR was defined as a homeostasis model assessment of IR (HOMA-IR) higher than 95% for age and sex in of Korean adolescents [3,25]. Another reliable marker of IR, the triglyceride glucose (TyG) index, was additionally analyzed. The TyG index has been proposed as a more efficient IR indicator compared to the HOMA-IR score [26]. The formulas are: HOMA-IR=[FPG (mg/dL)Ăfasting insulin (ÎźIU/mL)/405]; TyG index=ln[TG (mg/dL)Ă FPG (mg/dL)/2] [27].
5. Statistical analysis
The LMS method estimates 3 parameters: the power parameter of the Box-Cox transformation (lambda [L]), the median (mu [M]), and the generalized coefficient of variation (sigma [S]) by age and sex. The z-score, or standard deviations (SDs) from the mean, by age and sex can be calculated from LMS parameters: z-score=[(estimated value/M)Lâ1)/ (L Ă S)]. The maximum penalized likelihood method was used to calculate and smooth LMS parameters [28].
Variables with skewed distributions such as ASM, PASM, FPG, insulin, HOMA-IR, triglycerides, and HDL-C were log-transformed for the analysis and reported as geometric means and standard errors. Data are shown as β-coefficient, standard error, and P-value for linear regression analysis and as adjusted odds ratio (aOR), 95% confidence interval (CI), and P-value for logistic regression analysis. Multivariate analyses were performed after adjusting for age, sex, household income (quintile), daily energy intake, and BMI z-score. A subanalysis was conducted by stratifying data into BMI z-score < 2 and BMI z-score ⼠2 groups. Stata, version 16.1 (StataCorp LP, College Station, TX, USA) was used to perform all statistical analyses. All numbers and percentiles used to analyze the relationship between PASM and MS were weighted and computed using the svy command to adjust for the KNHANES sampling design. The marginsplot command was utilized for graphical visualization of the predicted probability of MS and IR according to the PASM z-score. A 2-sided P-value less than 0.05 was considered statistically significant.
6. Ethical statement
The KNHANES was approved by the Institutional Review Board of the Korea Centers for Disease Control and Prevention (2009-01CON-03-2C, 2010-02CON-21-C, and 2011-02CON-06-C). All participants and/or their legal guardians in the KNHANES 2009-2011 provided informed consent. The present study was approved by the Institutional Review Board of Seoul National University Bundang Hospital (approval No. X-1911/579-905). All procedures were performed in accordance with the Declaration of Helsinki.
Results
1. ASM reference
There were 1,522 subjects whose ages ranged from 10 to 18, comprising 807 boys (53.0%) and 715 girls (47.0%). The mean and SD of the z-scores for height, weight, and BMI were 0.24Âą0.04, 0.08Âą0.04, and -0.05Âą0.04, respectively. The z-scores for height, weight, and BMI of boys (girls) had means and SDs of 0.28Âą0.05 (0.18Âą0.05), -0.11Âą0.06 (0.05Âą0.06), and -0.05Âą0.06 (-0.05Âą0.06), respectively.
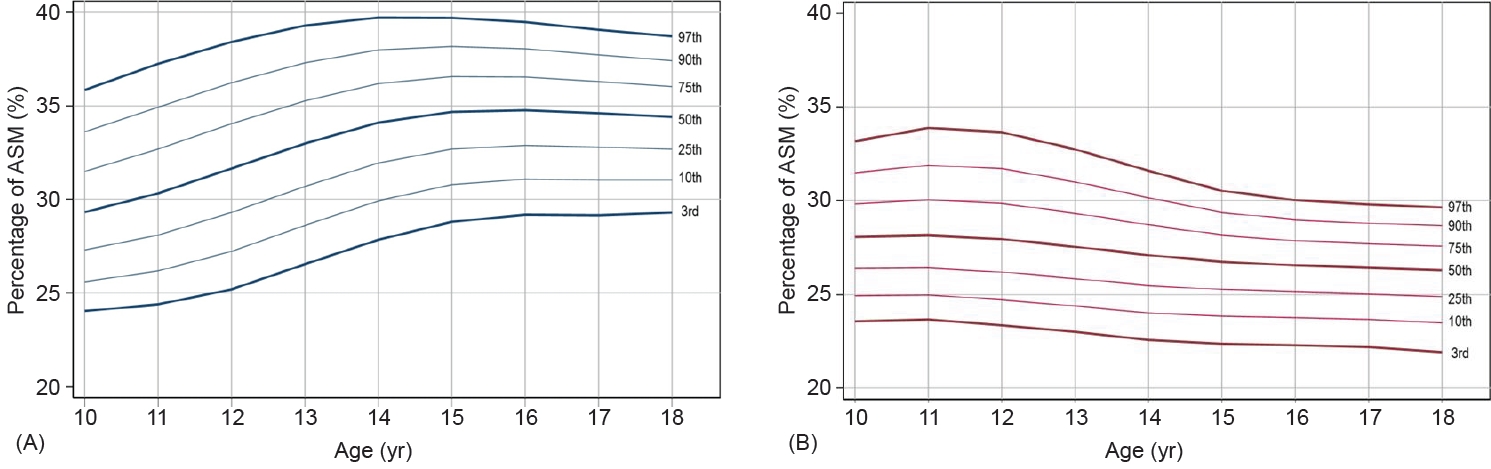
Table 1 shows the L, M (50th percentile), and S values and the 3rd, 10th, 50th, 90th, and 97th percentiles for PASM at each age for boys and girls. The reference percentiles for PASM are shown in Fig. 1. Boys had generally higher values compared to girls regardless of age. PASM increases with age in boys, as shown by the 50th percentile increase from 25.1% to 31.1% (Fig. 1A). Girls, however, have a distinct pattern, with PASM decreasing with age after peaking at 10â12 years, as shown by the 50th percentile decreasing gradually from 25.2% to 23.6% between 10 to 18 years of age (Fig. 1B).
2. PASM and MS
Table 2 summarizes the clinical characteristics of the study population tested for MS. There were 1,174 participants, 613 boys (52.7%) and 561 girls (47.3%). The mean age of both boys and girls was 13.9Âą0.1 years. Girls had significantly lower ASM and PASM values than boys (girls: ASM 13.2Âą0.1 kg, PASM 26.9%Âą0.2%; boys: ASM 18.3Âą0.2 kg, PASM 32.8%Âą0.2%). The z-scores for boys' and girls' PASM were 0.09Âą0.06 and -0.14Âą0.07, respectively.
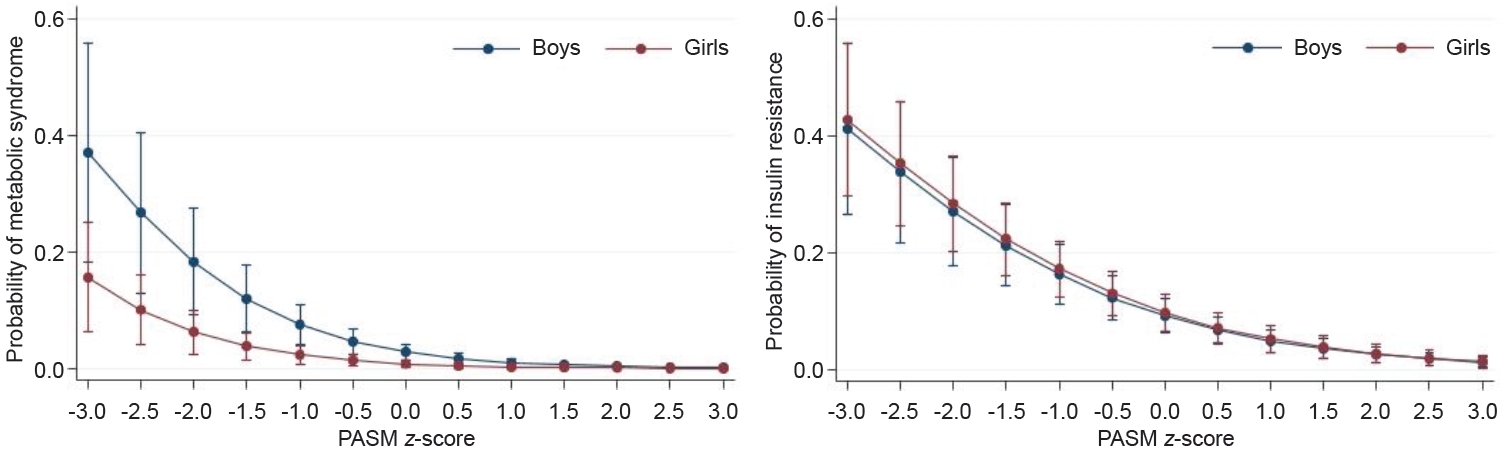
The results of multivariate linear regression analysis for the relationships between PASM and MS or IR are shown in Table 3. PASM had inverse associations with PsiMS, HOMA-IR, and TyG index when adjusting for age, sex, household income, and daily caloric intake (PsiMS: β=-0.105, P<0.001; HOMA-IR: β=-0.104, P<0.001; TyG index: β=-0.013, P<0.001). Sex-stratified analysis showed significant negative associations between the PASM z-score and MS or IR (Fig. 2). The interaction between PASM z-score and MS showed higher correlation in boys than girls (Fig. 2A). Boys and girls had a similar association between the PASM z-score and IR (Fig. 2B). The predictive probability of MS and IR both decreased as the PASM z-score increased.
The aORs for MS and IR computed using PASM z-score are shown in Supplementary Table 1. Increased PASM lowered the risk of obesity (aOR, 0.22; 95% CI, 0.17â0.30), abdominal obesity (aOR, 0.27; 95% CI, 0.20â0.36), high BP (aOR, 0.65; 95% CI, 0.52â0.80), and elevated triglycerides (aOR, 0.67; 95% CI, 0.56â0.79). There was no statistically significant association between PASM and FPG. MS and IR had aORs of 0.34 (95% CI, 0.26â0.45) and 0.50 (95% CI ,0.41â0.62), respectively.
We stratified subjects into 2 groups based on the BMI z-score and conducted additional analyses (Supplementary Tables 2, 3). In the nonobese group (BMI z-score < 2), the PsiMS, HOMA-IR, and TyG index were all negatively associated with PASM (PsiMS, β=-0.080; HOMA-IR, β=-0.079; TyG index, β=-0.011, all P<0.001). When the BMI z-score was added as a covariate, only the TyG index demonstrated a significant negative correlation with PASM (β=-0.005, P=0.033). Additionally, in this group, MS (aOR, 0.38; 95% CI, 0.28-0.52) and IR (aOR, 0.57; 95% CI,0.46-0.71) showed a significant decreasing trend with increasing PASM. In the total population and the population of girls in the obese group (BMI z-score >2), only PsiMS had a significant negative correlation with PASM (β=-0.135, P=0.004). aORs for MS and IR were not significant in the obese group.
Discussion
The present study introduces the reference value of PASM for Korean adolescents aged between 10 and 18. The reference value was established using nationally representative data acquired from the 2009â2011 KNHANES. Since low PASM was shown to increase the risk of MS and IR, clinicians need to have a reference value when evaluating a patient's metabolic status.
Total lean body mass is strongly correlated with skeletal muscle mass. ASM is used as a major indicator of sarcopenia because of its high association with skeletal muscle mass [5]. We measured body composition by DXA and calculated z-scores for ASM indices, including PASM, in adolescents.
Changes in PASM are demonstrated differentially in distinct ethnic groups. These distinctions may be due to genetics, so nation-specific reference values are important. While American girls' PASM increase until adulthood, Korean and Chinese girls have a maximum PASM at the age of 10â12 that declines during the subsequent adolescence period [29,30]. A study was conducted to obtain ASM reference indices in Korea, but the LMS values were not provided in the report [31]. The LMS value can be useful in clinical and research settings to obtain the z-score and its percentile of patients compared to the entire population. The strength of this study is its provision of LMS values of PASM by age and sex in Korean adolescents.
In terms of annual changes in PASM, sex was a significant contributor. PASM increases gradually in boys, but the curve is relatively flat in girls. In girls, lean mass and lean mass index tend to increase with age. However, the slope progressively becomes less steep and flattens when reaching adulthood [32]. Girls aged between 10 and 18 may gain more FM than muscle mass, resulting in a decrease in PASM. In contrast, boys' PASM increased at a faster rate until later in life. Sex discrepancy may have resulted from differences in puberty and sex hormones, but further research is needed to identify the causes.
Early diagnosis of MS and management of future risk factors are important because MS in adolescence often carries over into adulthood [33]. Low muscle mass in the elderly has been linked to an increase in MS [8,34,35]. Interest in the association between metabolic dysfunction and skeletal muscle mass in youths developed recently [11,36]. The relationship between low skeletal muscle mass and MS in the pediatric population has only been addressed in a small number of studies. In a study of pediatric subjects using national data in the United States, low muscle mass was reported to have a correlation with metabolic risk factors; however, no direct analysis on MS and IR was performed [11]. Other studies that included adolescents simply compared MS risk with the presence of relatively low muscle mass [12,13].
To the best of our knowledge, the present study is the first to integrate PASM into the evaluation of MS and IR in the pediatric population. The inverse association between the PASM z-score and MS or IR in adolescents was also validated in the study. PsiMS, HOMA-IR, and TyG index, which represent MS and IR as continuous variables, had significant negative correlations with PASM. Each component of MS, except FPG, was significantly related to PASM. Elevated FPG was found in only 5 of 1,174 individuals. This number was too small to compare other cardiometabolic risk factors. Statistical analysis and its significance were challenging. In contrast, IR was observed in 185 individuals, making it more common than elevated FPG. Importantly, in the context of PASM, the aOR for IR was significantly lower. We expect that low PASM is associated with impaired insulin action. In adult studies, the incidence of impaired FPG and type 2 diabetes has been reported to be increased in individuals with low ASM [37,38]. Due to the young age of the subjects, the time may have been insufficient for IR to develop into FPG. Therefore, further follow-up studies with larger sample sizes are needed to better understand the association between ASM and metabolic risks in adolescents.
We conducted additional stratified analyses to evaluate the potential confounding effects of obesity status. Specifically, we examined whether the results differed based on BMI z-scores. In the nonobese group with a BMI z-score less than 2, MS and IR tended to decrease as PASM increased. However, except for PsiMS, these tendencies were lost in the obese group with a BMI z-score of 2 or more. Consistent with our findings, studies in adults similarly reported a loss of protective effect of muscle mass in the obese group compared to the nonobese group [38]. A complete mechanism for this remains unclear. One hypothesis is that body weight and ASM tend to be proportional in obese patients, with a concomitant increase in intramuscular lipid portion [39]. The increased intramuscular lipid content in obese patients may reduce the impact of ASM on metabolic risk by interfering with its ability to accurately gauge pure fat-free mass. Another hypothesis is that the harmful effects of adiposity and the protective effects of muscle may interact, resulting in the harmful effects of adiposity outweighing the beneficial effects of muscle in the obese group, canceling the gains from muscle [38,40].
The limitations of this study are as follows. First, establishing a causal relationship between PASM and MS was not possible because of the weakness of the cross-sectional study design. Second, puberty status was not applied to the analysis due to a lack of data. Since puberty is an important time for muscle mass acquisition, a more detailed analysis could have been conducted had puberty status information been available. Third, there were no DXA data for children under the age of 10, so reference values could not be obtained. In the future, a study should determine the ASM reference for younger children.
In conclusion, the LMS reference value provided in this study may offer clinicians information that will enable the effective management of patients. The chance of acquiring MS and IR increases with declining skeletal muscle mass. Based on the results of the current study, we recommend that body composition be monitored contingent on the reference values. Further longitudinal studies are required for long-term outcomes in children and adolescents with varying degrees of muscle mass.