


Highlights
· The prevalence of adolescents with type 2 diabetes mellitus (T2DM) has rapidly increased in Korea over the past few decades with the increase in the number of obese adolescents.
· SPISE is a promising marker for predicting adolescent T2DM.
Introduction
Owing to the spread of western dietary and sedentary behaviors, the incidence of obesity and type 2 diabetes mellitus (T2DM) has increased in Korean adolescents; the percentage of T2DM among all diabetes mellitus adolescents increased four-fold from 5.3% in 1990 to 21.0% in 2000 [1].
In a 10-year study of type 1 diabetes mellitus (T1DM) and T2DM in adolescents <15 years of age conducted between 2001 and 2010, T1DM had a higher prevalence than T2DM; however, the increase in prevalence each year was higher for T2DM than T1DM [2].
Insulin resistance plays a major role in the development of T2DM [3]. Homeostatic model assessment of insulin resistance (HOMA-IR) as an insulin sensitivity index has been used to assess insulin resistance in obese children [4]. The single point insulin sensitivity estimator (SPISE) has also been used as a surrogate marker for insulin sensitivity to predict metabolic syndrome and screen for T2DM in adults. [5-7]. SPISE showed moderate to strong positive correlations with the euglycemic insulin clamp in both adults and juveniles based on an independent study cohort [8]. However, few studies have investigated the utility of SPISE in adolescents with T2DM.
In this study, we analyzed differences in the proportions and levels of clinical and biochemical indicators, including HOMA-IR and SPISE, among normoglycemic overweight or obese adolescents, those with prediabetes, and those with T2DM to identify factors independently associated with T2DM. In particular, we aimed to determine the efficacy of SPISE as a predictor of adolescent T2DM.
Materials and methods
1. Subjects
We retrospectively reviewed the medical records of 104 adolescents (60 males and 54 females) aged <18 years who were newly diagnosed with T2DM between January 1, 2010, and December 31, 2020, at the Korea University Pediatric Clinic. The diagnosis of T2DM was confirmed based on American Diabetes Association guidelines [9]. We enrolled 92 normoglycemic overweight/obese adolescents (body mass index [BMI] ≥85th percentile for their age and sex, fasting glucose<100 mg/dL or 2-hour glucose<140 mg/dL on oral glucose tolerance test [OGTT]) and 59 patients with prediabetes (fasting glucose of 100–125 mg/dL or 2-hour glucose of 140–199 mg/dL on OGTT). We recorded age, sex, height, weight, BMI (kg/m2), and the onset of puberty above Tanner stage II. Family history of T2DM was defined as having one or more first- or second-degree relatives diagnosed with T2DM [10]. Fatty liver was diagnosed based on the following ultrasound parameters: parenchymal brightness, liver-to-kidney contrast, deep beam attenuation, bright vessel walls, and gallbladder wall definition [11]. Acanthosis nigricans was defined as a skin condition characterized by areas of dark, velvety discoloration in body folds and creases [12].
2. Biochemical assessment
Venous blood samples were taken after an 8-hour fast and analyzed. Fasting glucose, alanine aminotransferase/aspartate aminotransferase (ALT/AST), total cholesterol (TC), high-density lipoprotein cholesterol (HDL-C), low-density lipoprotein density (LDL-C) cholesterol, and triglyceride (TG) levels were measured by enzyme analysis. Insulin levels were measured by the immuno-radiometry method using 125I. The HOMA-IR was calculated based on fasting insulin and glucose using the following equation: HOMA-IR=fasting glucose (mg/dL)×fasting insulin (mU/mL)/405 [4].
The HOMA-IR cutoff point in the pubertal period is 5.22 in boys and 3.82 in girls [4]. SPISE was calculated based on HDL and TG levels and BMI using the following equation:
SPISE = 600×HDL-C0.185/(TG0.2×BMI1.338) [8].
3. Statistical analysis
Data were analyzed using IBM SPSS Statistics ver. 20.0 (IBM Co., Armonk, NY, USA) software. To determine the significance of differences in clinical and biochemical variables between normoglycemic overweight or obese, prediabetic, and T2DM groups, 1-way analysis of variance was used for continuous variables and the chi-square test was used for nominal variables. Receiver operating characteristic (ROC) analysis was performed with the Youden Index to determine the cutoff point of SPISE. Independent variables that showed a significant correlation with T2DM in univariate logistic regression and that did not have a variance inflation factor value of 10 or above were analyzed using multiple logistic regression analysis after adjustment for age, sex, and BMI standard deviation score (SDS) to evaluate risk factors that directly affect T2DM, the binary dependent variable. Continuous data are represented as the mean (±standard deviation) and categorical data as the number (%). A P-value less than 0.05 was considered to indicate statistical significance.
Results
1. Clinical characteristics of adolescents with T2DM compared to normoglycemic overweight/obese adolescents and prediabetic adolescents
Average age of T2DM subjects was 14.42±1.91 years and their average BMI was 28.39±4.62 kg/m2. Mean levels of BMI SDS were similar among groups. Adolescents with T2DM were more likely to have a family history of T2DM among the 3 groups (45.7%, 47.4% vs. 74.0%, P<0.01), while the proportion of subjects with a family history of T2DM was similar between adolescents who were normoglycemic overweight/obese or prediabetic. Adolescents with T2DM had the highest proportion of fatty liver among the three groups (28.3%, 47.4% vs. 73.0%, P<0.01), followed by those in the prediabetes and normoglycemic overweight/obese groups. The proportion of acanthosis nigricans was similar among the 3 groups (Table 1).
2. Biochemical characteristics of adolescents with T2DM compared to those of normoglycemic overweight/obese adolescents and prediabetic adolescents
Adolescents with T2DM had the highest levels of AST and ALT among the 3 groups (46.23±36.38, 70.25±62.05 mg/dL, P<0.01, respectively), followed by those in the prediabetes and normoglycemic overweight/obese groups, respectively. Interestingly, adolescents with T2DM were more likely to have higher levels of TC, TG, and LDL-C (195.35±42.57, 164.99±108.17, 125.29±37.80 mg/dL, P<0.01, respectively) and lower HDL-C levels (42.15±8.65, P<0.01) among the 3 groups, while levels of TC, TG, LDL-C, and HDL-C were similar between adolescents in the normoglycemic overweight/obese and prediabetes groups.
Adolescents with T2DM had the highest HOMA-IR (4.95±2.92, P<0.01) among the 3 groups, while HOMA-IR was similar between those in the normoglycemic overweight/obese and prediabetes groups.
SPISE level in patients with T2DM was significantly lower than in patients in the normoglycemic overweight/obese groups, while SPISE level was similar between patients with prediabetes and those with T2DM (Table 2).
3. Insulin resistance index cutoff point for predicting obese adolescents with T2DM
More adolescents with T2DM were likely to have a HOMA-IR value above the cutoff point than those in the normoglycemic overweight/obese groups (63.5% vs. 44.6%, P<0.05), while there was no significant difference in number of individuals with a HOMA-IR value above the cutoff point between adolescents in the T2DM and prediabetes groups (63.5% vs. 59.3%, P=0.601).
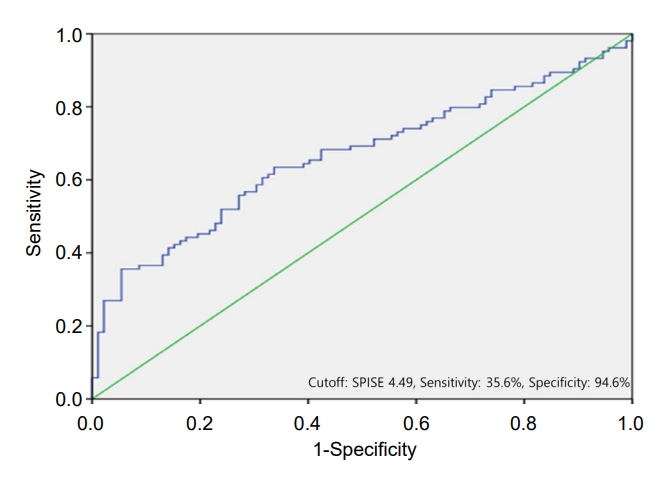
Area under the curve (AUC) was used to determine the diagnostic performance of the SPISE for T2DM. Statistically optimal SPISE cutoff point for T2DM was 4.49 (AUC, 0.665; 95% confidence interval [CI], 0.589–0.741), with a sensitivity of 35.6% and specificity of 94.6% (Fig. 1).
More adolescents with T2DM were likely to have a SPISE values less than 4.49 than those in the prediabetes and normoglycemic overweight/obese groups (35.6% vs. 11.9% and 5.4%, respectively, P<0.01), while the proportion of adolescents with a SPISE value less than 4.49 was similar between the normoglycemic overweight/obese and prediabetes groups.
4. T2DM risk factor analysis
In univariate logistic regression analysis, the following risk factors were significantly correlated with T2DM: family history of T2DM (odds ratio [OR], 3.395; 95% CI, 1.863–6.189; P<0.01), fatty liver (OR, 6.890; 95% CI, 3.679–12.904; P<0.01), HOMA-IR above the cutoff value (OR, 2.160; 95% CI, 1.218–3.832; P<0.01), and SPISE<4.49 (OR, 9.609; 95% CI, 3.582–25.755; P<0.01).
In multiple logistic regression analysis, after adjustment for age, sex, and BMI SDS, family history of T2DM (OR, 3.812; 95% CI, 1.585–9.166; P<0.01), fatty liver (OR, 4.631; 95% CI, 1.848–11.603; P<0.01), and SPISE<4.49 (OR, 50.307; 95% CI, 8.053–314.255; P<0.01) were significantly associated with T2DM. However, a HOMA-IR value above the cutoff point (OR, 1.217; 95% CI, 0.512–2.891; P=0.708) was not significantly associated with T2DM in multiple logistic regression analysis (Table 3).
Discussion
Our study revealed that a family history of T2DM, fatty liver, and SPISE<4.49 were independent risk factors for T2DM in obese adolescent. Notably, our results suggest that hyperlipidemia is associated with the development of T2DM.
Adolescent T2DM tends to be present more frequently in those individuals who are obese at the time of puberty and presents with the clinical features of acanthosis nigricans and a family history of T2DM [13-17]. In our study, after adjusting for age, sex, and weight, adolescents with T2DM were more likely to have a family history of T2DM than those in the normoglycemic overweight/obese and prediabetes groups. However, the proportion of acanthosis nigricans was similar among the three groups. Some previous studies have reported that insulin resistance plays a role in liver dysfunction such as fatty liver disease, and have found that it contributes to the occurrence of T2DM. [18,19].
Various methods have been developed to define insulin sensitivity. HOMA-IR is the most widely used indicator of insulin resistance and is based on the feedback loop of glucose and insulin in the postabsorptive state; thus, it is representative of hepatic insulin resistance, but not peripheral insulin sensitivity [20]. Factors other than insulin resistance contribute to the increase in glucose levels in T2DM. Therefore, indices based on fasting glucose and insulin levels alone may not accurately track changes in insulin sensitivity [21]. Moreover, gender differences in cutoff values should also be considered when evaluating insulin resistance [4]. HOMA-IR did not independently affect T2DM in the current study.
Hyperlipidemia has also been used as an indicator of insulin resistance. The liver plays a role in controlling lipid metabolism; therefore, deterioration of hepatic function can lead to hyperlipidemia, thereby resulting in reduced suppression of glucose renewal, which can lead to the development of T2DM [22,23]. In a study of hyperlipidemia in T2DM, Chen et al. [24] revealed that hyperlipidemia is associated with elevated blood glucose levels. In our study, adolescents with T2DM were more likely to have higher levels of TC, TG, LDL-C, and lower HDL-C levels among the three groups, while levels of TC, TG, LDL-C, and HDL-C were similar between those in the normoglycemic overweight/obese and prediabetes groups.
The TG/HDL-C ratio was introduced as a tool to estimate insulin resistance, as circulating lipid measurements are available in routine settings [8]. Mathematical modeling was applied to refine the TG/HDL-C ratio, including BMI, fasting TG, and HDL-cholesterol, and, as a result, the SPISE was invented. SPISE showed a significantly better adjusted ROC than the TG/HDL-C ratio [8] and was used as a surrogate marker for insulin sensitivity to predict metabolic syndrome in adults [5] and to screen for T2DM in adults. [6,7]. Cederholma and Zetheliusb [6] revealed that SPISE was a strong predictor of T2DM in all participants, with an OR of 1.62 (1.27–2.05; P<0.001).
To the best of our knowledge, this is the first study to address SPISE in a pediatric population with T2DM in Korea. Correa-Burrows et al. [25] reported that the optimal cutoff for metabolic syndrome diagnosis was 5.0 in men and 6.0 in women, and the optimal cutoff for insulin resistance was 5.9 in men and 6.4 in women, respectively. In a European study that investigated SPISE in nondiabetic obese adolescents, a cutoff value for insulin resistance of 6.61 was obtained [8]. While there was no significant difference in the proportion of individuals with SPISE<6.61 in the normoglycemic overweight/obese and T2DM groups in our study, we found that a SPISE cutoff value of 4.49 predicted T2DM. Adolescents with T2DM were more likely to have a SPISE<4.49 among the three groups, and SPISE<4.49 independently affected the development of T2DM with an odds ratio of 50.3. SPISE could be applied in clinical studies for risk prediction of T2DM. In our study, the sensitivity of SPISE for predicting adolescent T2DM was only 35.6%, which is insufficient to consider its use as a single screening tool for adolescent T2DM especially given that in a previous study, HOMA-IR was shown to have a sensitivity of 56% in boys and 77.1% in girls for predicting T2DM.3) However, the specificity of SPISE in the study was 94.6%, which indicates that T2DM can be ruled out in individuals with a SPISE>4.49.
We could not propose a precise cutoff value based on our results due to the retrospective study design and the limited number of patients. Larger prospective studies are needed to determine precise cutoff values.
In conclusion, SPISE, family history of T2DM, and fatty liver are risk factors that can independently predict the occurrence of T2DM. Furthermore, SPISE is a promising marker for predicting adolescent T2DM and should be carefully monitored to prevent progression to T2DM.