


Highlights
┬Ę FGF21 has an independent diagnostic value for metabolic syndrome in children.
┬Ę FGF21 and leptin serum levels are inversely correlated with flow-mediated dilation, a measure of endothelial function.
┬Ę Endothelial function is worse in children with metabolic syndrome.
Introduction
Cardiovascular diseases and metabolic disorders, such as atherosclerosis, diabetes mellitus, and metabolic syndrome (MS), are considered the most frequent causes of morbidity and mortality worldwide. Diagnosis in very early stages (i.e., during childhood) using new easily quantifiable markers of atherosclerosis and metabolic disorders could be invaluable for the prevention of these diseases in adults.
A recently discovered molecule, fibroblast growth factor 21 (FGF21), has been proposed as a potent metabolic regulator. FGF21 is a signaling protein secreted in the blood stream and is an endocrine member of the 22 fibroblast growth factors family [1]. FGF21 is principally expressed in the liver, the brown and white adipose tissue in the pancreas, and in multiple other tissues in lesser amounts. The hepatic tissue is principally responsible for the majority of the circulating FGF21 [2]. To achieve metabolic homeostasis, the actions of FGF21 are mediated in the periphery and in the central nervous system through its receptor (FGFR) and the formation of a heterodimer with coreceptor ╬▓-klotho [3]. FGF21 acts with the heterodimer in hepatic tissue to lower cholesterol, exerting its actions in multiple tissues and different metabolic pathways, especially those involved in lipids and glucose [4]. FGF21 serum levels are influenced by various metabolic disorders; levels are increased in obesity and correlate with fasting insulin, homeostasis model assessment-insulin resistance (HOMA-IR), waist circumference, and body mass index (BMI) in adults [5]. FGF21 is also increased in the serum of patients with coronary artery disease [5]. A possible FGF21 resistance has been shown in states of obesity indicating that supra-physiological doses are required to mediate the effects of FGF21 in these states [6]. Other biologic molecules such as leptin, adiponectin, and insulin-like growth factor binding protein-1 (IGFBP1) have been studied in adults as potential markers of metabolic and cardiovascular diseases due to their action on metabolism and response to different metabolic conditions [7-9]. However, data are limited on the role of FGF21 and other molecules in childhood.
In the present study, the potential value of the novel candidate markers of early cardiovascular and metabolic disorders in childhood, FGF21, leptin, adiponectin, and IGFBP1, was investigated. In addition, the association of these molecules with vascular function and structure indices of early endothelial dysfunction and atherosclerosis such as ultrasound-based flowmediated dilation (FMD) and carotid intima-media thickness (cIMT) were evaluated in a pediatric cohort.
Materials and methods
1. Population
This was a prospective cross-sectional study of a pediatric population in Northwestern Greece. Eligibility criteria were determined based on age (8ŌĆō16 years of age) and good health (absence of illness and no use of any medication). All children were free of any disease and visited the Pediatric Department of the University Hospital for routine medical examination prior to initiation of sport activities. The study included 100 children of which 22 were excluded due to incomplete/unavailable data. Written informed consent was signed by their parents/guardians. The study was conducted according to the Declaration of Helsinki and the study protocol was approved by the local Bioethics Committee.
2. Measures and definitions
Personal health history was recorded for all children. Standing height and body weight were measured in the morning using a wall mounted stadiometer and an electronic scale, respectively, with children wearing light clothing and no shoes. MS and waist circumference were determined according to the International Diabetes Federation (IDF) definition [10]. The BMI was calculated as weight/height2 (kg/m2) and BMI standard deviation score (SDS), and BMI percentiles were derived from the World Health Organization growth charts and used for defining normal weight, overweight, or obesity for each child. Blood pressure and heart rate were assessed in a quiet environment using an electronic sphygmomanometer before any further procedures were initiated.
The metabolic cluster score was assessed because it has been suggested as a powerful predictor of cardiovascular risk that can be calculated at any age using the following equation [11]:
1/5 ├Ś ([waist circumference ŌłÆ 77.7]/11.4 ŌĆō [high-density lipoprotein cholesterol ŌłÆ 44.6]/10.2 + [triglycerides ŌłÆ 90.5]/52.9 + [systolic blood pressure ŌłÆ 107.6]/9.2 + [glucose ŌłÆ 88.2]/7.4).
Serum samples were collected using a standard centrifuge procedure and directly analyzed for some parameters and for other parameters stored at -80Ōäā in a laboratory freezer until assaying.
Liver function tests (aspartate aminotransferase and alanine aminotransferase) and lipid profile (total cholesterol, triglycerides, and high-density lipoprotein level cholesterol) were analyzed using a Beckman Coulter AU5800. Low-density lipoprotein cholesterol was derived from the Friedewald formula. Apolipoprotein A, apolipoprotein B, and lipoprotein A were analyzed on the nephelometer Siemens BM ProSpec (Siemens AG, Munich, Germany).
Glucose homeostasis was assessed using HOMA-IR (fasting blood glucose [mmol/L] ├Ś fasting blood insulin [╬╝U/mL])/22.5 [12]. Glucose was analyzed on the Beckman Coulter AU5800 and insulin was measured on the Beckman Coulter Dx1800 (Beckman Coulter, Inc., Brea, California, USA).
The biomarkers FGF21, adiponectin, leptin, and IGFBP1 were measured using enzyme-linked immunosorbent assays. The Human FGF21 Quantikine ELISA kit used for FGF21 was purchased from R&D Systems (Minneapolis, M╬Ø, USA). The sensitivity of the method was 4.67 pg/mL and the coefficients of variation (CVs) were 3.9% and 10.9% for intra- and interassays, respectively. Leptin was assessed using the Leptin Sandwich ELISA kit (DRG Diagnostics GmbH, Marburg, Germany). The sensitivity of the method was 1.0 ng/mL and the respective CVs were 6% and 9%. Adiponectin (Human adiponectin ELISA) was assessed using the kit purchased from Biovendor (Research and Diagnostic Products, Brno, Czech Republic). The sensitivity of the method was 26 ng/mL and the respective CVs were 5.9% and 6.3%. Insulin was measured using the kit purchased from DIAsource ImmunoAssays SA (IGFBP-1 ELISA KARME 01, Louvain-la-Neuve, Belgium). The sensitivity of the method was 0.02 ng/mL and the respective CVs were 5.2% and 5.9%.
3. Ultrasound vascular studies
Ultrasound vascular studies were performed after children fasted for 6 hours. Measurements were taken with subjects in the supine position in a temperature-controlled room (approximately 22Ōäā) in a quiet environment. A Doppler ultrasound (Ultrasound ATL, HDI 5000, Philips Ultrasound, Inc., Bothell, WA, USA) and 5- to 12-MHz transducer was used for optimal imaging.
1) Carotid intima-media thickness
The cIMT measurements were performed using a standardized protocol according to previously published recommendations for children and adolescents [13,14]. Three consecutive longitudinal images of each common carotid artery 1ŌĆō2 cm proximal to the bifurcation were acquired. The mean values of intima-media thickness for right and left common carotid artery were obtained by averaging 3 measurements at the far wall of each artery. Finally, the maximum cIMT of the 2 common carotid arteries was determined for each child.
2) Brachial artery FMD
Endothelial function was assessed by measuring endothelium-dependent vasodilation in the right brachial artery in response to hand hyperemia based on a previously described methodology for children and adolescents [13,14]. Images were acquired at baseline and every 30 seconds from the first to the third minute after deflation of a wrist cuff inflated to 250 mmHg for 4 minutes for measurement of FMD (% increase in arterial diameter compared with baseline diameter). Brachial artery blood flow was measured using pulsed wave Doppler at baseline and 15 seconds after cuff-release.
Determination of the relative vascular wall margins at end-diastolic brachial diameter and cIMT was performed by 2 blinded operators off-line using the QLAB software (Philips Ultrasound, Inc., Bothell, WA, USA).
3) Shear stimulus and normalized FMD
Imposed shear stress stimulus magnitude is associated with FMD magnitude. To compare the FMD response between groups, the variation in the magnitude of the shear stress stimulus was considered and the FMD response normalized to the magnitude of the shear stimulus [15]. Shear rate, an estimate of shear stress without viscosity, was used to quantify the stimulus for FMD and calculated as mean blood flow velocity/vessel diameter [15]. Because the peak of the shear stress stimulus induced by reactive hyperemia occurs within the first seconds post cuff-release, the brachial artery mean blood flow velocity at 15 seconds post cuff-release was used to calculate the peak shear rate. The peak %FMD during the first 90 seconds (i.e., within the time the peak vessel diameter adaptation is typically observed) was divided by the peak shear rate resulting in the normalized FMD that was used for all comparisons.
4. Statistical analysis
The normality of the data was tested using the Kolmogorov-Smirnov test and most variables of interest (including FGF21, leptin, HOMA-IR, IGFBP1, and normalized FMD) were found to deviate from the normal distribution. Accordingly, continuous variables were presented as median (interquartile range, IQR). Nonparametric analysis using the Wilcoxon-Mann-Whitney test was used to compare continuous variables between the 2 groups. The correlation between continuous variables (e.g., FGF21 serum levels and normalized FMD) was investigated using the Spearman rho (Žü) correlation coefficient. Receiver operating characteristic curve (ROC) analysis was performed to identify the best cutoff values (Youden index: max [sensitivity and specificity]) of biomarkers (FGF21 and leptin) for the diagnosis of MS. Logistic regression analysis was performed to investigate the association of biomarkers (FGF21 and leptin) with MS. The level of statistical significance was set at P<0.05. The SPSS ver. 17.0 (SPSS Inc., Chicago, IL, USA) was used for analysis.
Results
1. MS and obesity in childhood
In the present study, 12 of the 78 children (15%) were diagnosed with MS and all were obese. Among the 66 children without MS (non-MS), 37 had normal BMI (non-MS-N) and 29 had increased BMI, (obese/overweight; non-MS-O). The results regarding biochemistry tests, metabolic markers, and vascular indices for all groups and subgroups are shown in Table 1 and Supplementary Table 1.
2. Glucose homeostasis, lipid profile, and liver function in children with and without MS
HOMA-IR in children with MS was significantly higher compared with children without MS (Table 1). Apolipoprotein B (ApoB) and the ApoB/ApoA ratio were significantly increased in the MS group compared with the non-MS group; however, lipoprotein(a) was decreased in the MS group compared with the non-MS group. Liver function assessment showed increased serum alanine aminotransferase values in the MS group compared with the non-MS group (Table 1).
3. Novel metabolic markers in children with and without MS
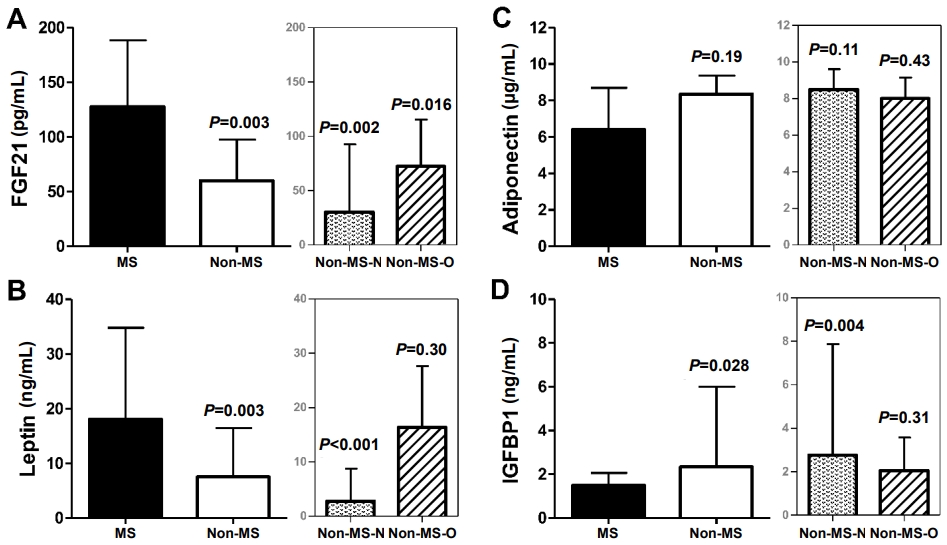
The MS group showed significantly increased FGF21 and leptin serum levels compared with the non-MS group (Fig. 1, Supplementary Table 1). Adiponectin levels were not significantly different; however, IGFBP1 levels were significantly decreased in the MS group compared with the non-MS group.
Comparisons between the MS and the non-MS groups and between the MS and each of the non-MS-N and non-MS-O subgroups showed similar results except for leptin, leptin/adiponectin ratio, and IGFBP1, which did not differ between the MS and the non-MS-O groups (Fig. 1, Supplementary Table 1).
4. MS cluster score
Children in the MS group had higher cluster score than children in the non-MS group (median [IQR]: 1.20 [0.73ŌĆō1.62] vs. -0.03 [-0.50 to 0.51], P<0.001).
5. Vascular indices in children with and without MS
Normalized FMD was lower in children with MS than in children without MS (P=0.06) but without statistical significance and was significantly lower in children in the MS group than in the children in the non-MS-N subgroup (Fig. 2, Supplementary Table 1). Normalized FMD did not differ between the MS group and the non-MS-O subgroup. Differences in cIMT measurements were not observed between groups and subgroups (Fig. 2, Supplementary Table 1).
6. Correlations: biomarkers, metabolic cluster score, and normalized FMD
Supplementary Table 2 shows a list of the correlations. Normalized FMD was significantly negatively correlated with FGF21, leptin (Fig. 3), HOMA-IR, and leptin/adiponectin ratio. The cIMT did not correlate with any of the parameters investigated. FGF21 positively correlated with leptin and HOMA-IR, and negatively with IGFBP1. Leptin positively correlated with HOMA-IR and negatively with adiponectin and IGFBP1. In addition, IGFBP1 negatively correlated with HOMA-IR. The MS cluster score showed a positive correlation with FGF21, leptin, and HOMA-IR.
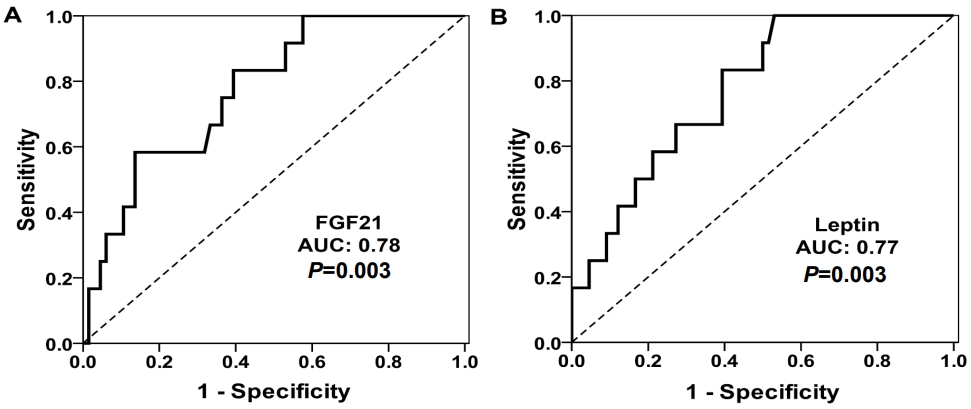
7. FGF21 and leptin for the diagnosis of MS
The ROC analyses for FGF21 and leptin as markers to diagnose MS are shown in Fig. 4. The area under the curves showed similar discrimination capability for FGF21 (0.78; 95% confidence interval [CI], 0.65ŌĆō0.90; P=0.003) and leptin (0.77; 95% CI, 0.65ŌĆō0.90; P=0.003), and IGFBP1 was less discriminatory (0.71; 95% CI, 0.56ŌĆō0.85; P=0.028). Adiponectin was not included in the ROC analyses because previously a significant difference in adiponectin levels was not observed between the MS and non-MS groups between the MS and non-MS groups.
In the present study cohort, the best cutoff value of FGF21 levels to identify the presence of MS was above 121.3 pg/mL, with a sensitivity of 58.3% and a specificity of 86.4%. A high FGF21 value (>121.3 ng/L) was significantly associated with MS diagnosis (odds ratio, 8.87; 95% CI, 2.31ŌĆō34.06; P=0.001). For every 10-pg/mL increase in FGF21 serum levels, the odds for presence of MS increased by 12% (odds ratio, 1.12; 95% CI, 1.03ŌĆō1.22; P=0.006). For leptin, the best cutoff value was above 5.85 ng/mL, with a sensitivity of 100% and a specificity of 47%. For every 1-ng/mL increase in leptin serum levels, the odds for presence of MS increased by 8% (odds ratio, 1.08; 95% CI, 1.01ŌĆō2.09; P=0.015).
After adjusting for BMI SDS, age, and sex, only FGF21 remained significantly associated with MS (odds ratio per 10-pg/mL increase: 1.10; 95% CI, 1.01ŌĆō1.22; P=0.043) and leptin did not remain significantly associated (odds ratio per 1-ng/mL increase: 1.01; 95% CI, 0.97ŌĆō1.05; P=0.643). Therefore, after adjusting for BMI, age, and sex for every 10-pg/mL increase in FGF21 serum levels, the odds for presence of MS increased by 10%.
Discussion
The main findings of this study are the following: (1) serum levels of the novel metabolic biomarkers FGF21, leptin, and IGFBP1 differed depending on the presence of MS or obesity in the pediatric population studied; (2) FGF21 was the only biomarker that differentiated children with MS from those without, irrespective of BMI, age, or sex, thus, increased FGF21 serum levels were an independent predictor of the presence of MS with a good diagnostic performance; (3) FMD was impaired in children with MS; (4) FGF21, leptin, and HOMA-IR inversely correlated with normalized FMD.
A novel finding was the correlation of FGF21 with impaired vascular endothelial function in childhood. In addition, the cutoff serum value for FGF21 (121.3 ng/mL) had good diagnostic accuracy for identifying the presence of MS in the study population.
1. Effects of MS on metabolic parameters in children
In a school-based cross-sectional study of 1,513 Black, White, and Hispanic adolescents, the prevalence of MS was determined using definitions from the National Cholesterol Education Program Adult Treatment Panel III and World Health Organization guidelines. Among the populations studied, obesity was the main risk factor for MS [16]. Similarly, in a Mediterranean pediatric cohort, the prevalence of MS was assessed using the IDF criteria and a low prevalence of MS (0.7%) was observed among the children studied, who were all obese [17]. In agreement with these studies, all children with MS were found to be overweight/obese in the present study. Further categorization based on the BMI of the study cohort provided useful insight into subtle differences between children with MS and children who were obese but did not fulfill the diagnostic criteria for MS.
Liver function has been shown to be affected in states of obesity or MS, reflected by increased levels of serum transaminases [18]. In the present study, the upregulation of alanine aminotransferase in the MS group compared with the non-MS subgroups confirmed the results reported in the earlier studies. Central obesity is associated with insulin resistance, lipid profile, and increased blood pressure [19,20]. This association is supported by our findings of increased serum insulin and HOMA-IR in children with MS compared with children without MS. In addition, this association was confirmed by results showing the difference in HOMA-IR between MS and normal weight non-MS children was greater than between MS and overweight/obese non-MS children.
Serum ApoB/ApoA and total cholesterol (TChol)/highdensity lipoprotein (HDL) ratios are considered strong predictors of atherosclerosis. Alemzadeh et al. [21] studied the relationships between ApoB/ApoA-1 and TChol/HDL ratios and markers of inflammation and insulin resistance in obese adolescents; however, nonobese adolescents were not included in that study. The authors reported the presence of higher ApoB/ApoA-1 and TChol/HDL ratios in adolescents with MS. These findings are consistent with our results, which also showed a shift towards an atherogenic profile in the MS group compared with the non-MS group.
2. Regulation of newer metabolic biomarkers in MS and obesity: the distinct role of FGF21
Leptin is upregulated in states of obesity [22], which may explain the similar upregulation of leptin serum levels in both children with MS and those without MS but with obesity. In contrast to leptin, FGF21 levels did differ between the MS group and each of the 2 non-MS subgroups, thus, levels were significantly increased only in association with MS but not with obesity. FGF21 has been shown to act on white adipose tissue lipolysis, increase insulin-dependent glucose uptake in adipocytes, and revert insulin resistance, indicating FGF21 involvement in cross-talk in MS pathways [23]. Furthermore, FGF21 has been found to promote and support metabolic homeostasis by controlling the underlying mechanisms of MS and nonalcoholic fatty liver disease [24]. Increased FGF21 serum levels have been reported in adults that are obese, have type 2 diabetes mellitus, nonalcoholic fatty liver disease, or MS [25,26]. In adults, serum FGF21 levels were shown to increase after 7ŌĆō10 days of fasting indicating FGF21 contributes to the late stages of adaptive starvation [27]. Overall, the physiologic role of FGF21 is to promote the adaptation of metabolism in different conditions and mediate the link between different pathways associated with obesity, starvation, and stress [27]. MS encompasses various metabolic deregulations such as dyslipidemia and insulin resistance as well as increased blood pressure and obesity, and FGF21 is a key protective molecule upregulated possibly due to overexpression to increase its effectiveness in such states.
In pediatric populations, data on the regulation of FGF21 in MS are limited. Ko et al. [28] studied children 9 years of age and reported no association between FGF21 and MS defined by the age-modified criteria developed by the National Cholesterol Education Program's Adult Treatment Panel III. Notably, different diagnostic criteria to define MS may be a significant factor in studies on MS in pediatric populations. Reinehr et al. [29] found no relationship between FGF21 and obesity, MS defined by the IDF criteria, and nonalcoholic fatty liver disease in children 6ŌĆō14 years of age. However, the association of FGF21 with features of MS was assessed within the obese population, thus, information on the distinction between MS and obesity was not provided.
Leptin levels have been shown to be associated with FGF21 levels by lesser-known pathways [29]. Leptin primarily mediates energy homeostasis and satiety perception but is also linked to a state of resistance [6,22,30]. The role of leptin in MS has been explored in only a few other studies and leptin levels were increased in children with MS, which is in agreement with the present study results [31,32].
In the current study, only FGF21 was shown to be associated with the presence of MS independent of BMI, age, and sex, indicating an important diagnostic value of this molecule. Although leptin was also associated with MS in the study population, this association did not remain significant after adjusting for BMI, age, and sex, which was probably due to regulation of leptin primarily by increased fat deposition. Similar to the present study findings, in a study of 1,138 children using the IDF criteria for MS, leptin and adiponectin correlated with MS but this correlation was mediated by BMI [17].
In contrast to leptin, adiponectin has been described as a molecule with anti-inflammatory and anti-atherosclerotic actions, which can protect against vascular damage [33]. Therefore, the leptin/adiponectin ratio has been proposed as an atherogenic index [34]. In the present study, adiponectin levels were decreased in the MS population although nonsignificantly, and the leptin/adiponectin ratio was significantly increased reflecting the overall deregulation of serum biomarkers to a more atherogenic profile. We also propose the use of the FGF21/adiponectin ratio, which was significantly increased almost 3-fold in contrast to the leptin/adiponectin ratio in the MS group compared with the non-MS group and remained higher (with borderline significance) when the MS group was compared with the non-MS-O subgroup. These results indicate the FGF21/adiponectin ratio may be a more sensitive marker than the leptin/adiponectin ratio for the evaluation of MS in children and independent of obesity.
Serum IGFBP1 levels were decreased in the MS group compared with the non-MS group; however, this decrease was non-significant when the MS group was compared with the non-MS-O subgroup, emphasizing the effect of obesity on the regulation of IGFBP1 [35].
3. Endothelial function and association with biomarkers
Children in the MS group showed worse endothelial function (lower normalized FMD) compared with children in the non-MS group as well as those in the non-MS-N subgroup. In contrast, cIMT was not significantly different between any of the groups, indicating that structural vascular damage might not have yet occurred in this pediatric population.
From the 4 biomarkers investigated, only FGF21 and leptin were associated with impaired endothelial function. Leptin has been shown to be involved in the process of atherosclerosis by regulating the production of different proinflammatory cytokines, activating immune cells, and increasing oxidative stress [36], indicating that increased leptin levels may promote cardiovascular disease.
In contrast, FGF21 has been shown to play a protective role in the cardiovascular system by preventing oxidative stress in cardiomyocytes and preventing heart hypertrophy in mice [37,38]. In adults, FGF21 has been associated with subclinical atherosclerosis as evidenced by a positive correlation with cIMT independent of established cardiovascular risk factors [39]. In addition, FGF21 levels have been shown to be augmented in patients with coronary artery disease [40]. Therefore, FGF21 may be increased early in cardiovascular disease as a compensatory response. Based on the present study results in children, the inverse correlation of FGF21 with normalized FMD and the independent association of FGF21 with MS indicate a dual role of FGF21 as a marker of early metabolic deregulation and endothelial dysfunction.
4. Limitations
The study population was not large. Furthermore, this study was not designed to include follow-up of the subjects enrolled to investigate the predictive value of biomarkers for pathologic conditions in the future. However, for the first time, FGF21 was shown to identify the presence of MS and early changes in endothelial function in a cross-sectional study with a pediatric cohort.
5. Conclusion
Metabolic deregulation associated with endothelial dysfunction may be detected early in children and adolescents. FGF21 was shown to be a potent biomarker for identifying the presence of MS in children independently of BMI, age, or sex, and correlated with impaired endothelial function. Further research and larger prospective longitudinal studies in children are needed to show the prognostic value of FGF21 in vascular and metabolic health in later life.