Discriminatory performance of insulin-like growth factor 1 and insulin-like growth factor binding protein-3 by correlating values to chronological age, bone age, and pubertal status for diagnosis of isolated growth hormone deficiency
Article information

Abstract
Purpose
The discriminatory performance of insulin-like growth factor 1 (IGF-1) and insulin-like growth factor binding protein-3 (IGFBP-3) was investigated by correlating their values with chronological age (CA), bone age (BA), and pubertal status (PS) for diagnosis of isolated growth hormone deficiency (IGHD).
Methods
We evaluated IGF-1 and IGFBP-3 levels in 310 short-stature subjects subdivided into 2 groups: IGHD (n=31) and non-IGHD (n=279). IGF-1 and IGFBP-3 were assayed using immune-radiometric assay and transformed into standard deviation score (SDS) according to CA, BA, and PS.
Results
The highest sensitivity was found in IGF-1-SDS for CA and IGFBP-3-SDS for CA (22.6% and 30.0%, respectively). The highest specificity was found in IGF-1-SDS for PS and IGFBP-3-SDS for PS (98.2% and 94.4%, respectively). Groups with the highest positive predictive values were IGF-1-SDS for BA and IGFBP-3-SDS for BA (10.9% and 5.1%, respectively). Highest negative predictive values were seen in IGF-1-SDS for CA and IGFBP-3-SDS for CA (98.4% and 98.4%, respectively).
Conclusions
IGF-1-SDS for CA, instead of IGF-1-SDS for BA or PS, could be used as a standard variable for IGHD screening. The sufficiently high specificity of IGF-1-SDS for PS suggests that this value is a useful tool for identification of IGHD.
Introduction
Short stature is defined as height below the 3rd percentile for age and sex. According to Korean Health Analytics Data from the KCDC (Korean Center for Disease Control), 11,938 of 519,062 children (2.3%) were categorized as short stature [1]. Underlying factors for short stature include hormonal disorders, chronic illness, undernutrition, genetic conditions, nonsyndromic family trait, and constitutional delay of growth and development.
A hormonal cause of short stature termed isolated growth hormone deficiency (IGHD) is caused by abnormalities in the growth hormone (GH)-releasing hormone receptor. IGHD occurs in 1 of 4,000–10,000 individuals [2-6]. The prevalence of IGHD in short stature patients varies from 0.8% to 8.4% [7,8].
There is much debate on the validity of the provocative GH test due to its low reproducibility and high false positive rate. Variability of the results among provocative agents and peak GH cutoff value also are under debate. Despite these drawbacks, it is the most widely used diagnostic modality [9-11]. Serum levels of IGF-1 and IGFBP-3 are less invasive measures used to evaluate the GH axis with a single blood sample. If the diagnostic validity of serum IGF-1 and IGFBP-3 levels is established, they could aid in easier and safer diagnosis of IGHD compared to the GH provocation test. However, few studies have investigated the diagnostic value of these 2 simple and less invasive tests. Using the predetermined reference levels for serum IGF-1 and IGFBP-3 in all subgroups by age, sex, and pubertal stage, the authors of the current work investigated the diagnostic value of IGF-1 and IGFBP-3 levels by correlating the values to chronological age (CA), bone age (BA), and pubertal status (PS).
Materials and methods
1. Subjects
This study was a multi-institutional, 10-year retrospective study comprising 310 short-stature patients older than 4 years who visited our institutions from March 2009 to March 2019.
We applied the following inclusion criteria: (1) short stature defined as height below the 3rd percentile for age and sex; (2) BA radiography within 6 months from the provocative GH tests using the Greulich and Pyle method; BA was evaluated by averaging the values reported by 2 pediatric endocrinologists and one radiologist; (3) pubertal staging was established by pediatric endocrinologists at each hospital according to Tanner stage criteria based on breast development in girls and testicular volume in boys; (4) measurement of IGF-1 and IGFBP-3 levels was carried out using immune-radiometric assay (IRMA, Immunotech, Marseilles, France).
We applied the following exclusion criteria: (1) medical history of use of recombinant human GH, gonadotropin releasing hormone analogues, sex steroids or glucocorticoids; (2) endocrine disorders including precocious puberty, hypothyroidism, and Cushing disease; (3) chronic illnesses such as inflammatory bowel disease, celiac disease, occult renal disease, and anemia; or (4) genetic conditions such as Turner syndrome, Noonan syndrome, and short-stature homeoboxcontaining gene (SHOX) defect.
Two GH stimulation tests were conducted. Patients with a GH level less than 5 ng/mL were classified as GHD. All patients with GH deficiency underwent brain magnetic resonance imaging (MRI) to rule out intracranial cause of GH deficiency. Patients with no abnormal findings on brain MRI were classified as IGHD. L-dopa (49%), arginine (21%), glucagon (14%), insulin (10%), and clonidine (7%) were used as provocative agents.
2. Hormone assay
Measurement of IGF-1 and IGFBP-3 levels was carried out using immune-radiometric assay (IRMA, Immunotech). IRMA is an assay based on reversible and noncovalent binding of an antigen by a specific antibody and labeled with a radioactive nuclide 125I as a tracer. The intra-assay and interassay coefficients of variation were 6.3% and 6.8% for IGF-1, respectively, and 6.0% and 9.5% for IGFBP-3.
In IGF-1 assay, patient sample, dissociation buffer, and tracer are added to the monoclonal antibody-coated tube. After incubation for 1 hour at 18℃–25℃ with shaking, 2 monoclonal antibodies highly specific for IGF-1 but not for IGF-2 bind to 2 epitopes of IGF-1 protein, producing a sandwich-like antibody complex. After incubation, the contents of the tube are removed, and bound radioactivity is measured and is directly proportional to IGF-1 concentration in the sample. The IGF-1 assay requires a 1:100 predilution of serum with an assayspecific diluting agent. Prediluted sample and tracer are added to the coated tubes and incubated for 3 hours at 18℃–25℃ with shaking. An identical procedure was followed for IGFBP-3.
The standard deviation scores (SDSs) for IGF-1 and IGFBP-3 were the corresponding reference values from 2012 data from Korean children and adolescents [12]. That 2012 data contained only percentile values of IGF-1 and IGFBP-3 according to PS. For estimating the mean both growth factors according to PS, we considered the mean as the 50th percentile value of the 2 growth factors. For estimating the standard deviation (SD) of growth factors according to PS, we assumed SD = (75th percentile value–25th percentile value)/1.35. The IGF-1-SDS according to the reference values for CA, BA, and PS are denoted as IGF-1-SDS for CA, IGF-1-SDS for BA, and IGF-1-SDS for PS, respectively. The IGFBP-3-SDS according to the reference values for CA, BA, and PS are denoted as IGFBP-3-SDS for CA, IGFBP-3-SDS for BA, and IGFBP-3-SDS for PS, respectively.
3. Statistical analysis
Measurements and calculations were presented as mean±SD. Statistical analysis was performed using IBM SPSS Statistics ver. 21.0 (IBM Co., Armonk, NY, USA).
Comparisons among groups were made using chi-square test or Wilcoxon rank sum test. The variables were tested for normality using the Shapiro-Wilk test. When calculating the sensitivity and specificity, we set the cutoff values of IGF-1-SDS and IGFBP-3-SDS as -2 for diagnosis of IGHD [13,14]. When calculating the positive predictive value (PPV) and negative predictive value (NPV), we set the prevalence of IGHD as 2% in short-stature children and adolescents [15]. Receiver operator characteristic (ROC) curves were used to evaluate the discriminatory performance of IGF-1-SDS or IGFBP3-SDS in diagnosis of IGHD. The area under the curve (AUC) was interpreted as excellent (>0.90), very good (0.80–0.90), good (0.70–0.80), sufficient (0.60–0.70), bad (0.50–0.60), or not useful (<0.50) [16]. We constructed multivariable diagnostic models including height SDS, body mass index (BMI) SDS, BA delay, and growth factors using multivariable logistic regression. The AUC was used for assessing the discriminative ability of the multivariable logistic regression analysis. AUCs were compared between models using the DeLong method.
Results
1. Clinical characteristics and auxological data
A total of 310 subjects with short stature who met the inclusion criteria was included in the study. Mean age was 7.8±3.1 years (males/females, 51%/49%). Average delay of BA was 17.7±13.4 months. The cohort was subdivided into 2 groups of IGHD (n=31) and non-IGHD (n=279).
The clinical characteristics and auxological data of the subjects are described in Table 1. The mean CA and BA of the subjects in the non-IGHD group were 7.8±3.5 years and 6.5±3.3 years, respectively. The mean CA and BA of the subjects in the IGHD group were 8.2±2.9 years and 6.9±3.1 years, respectively. Differences in mean CA and BA between the 2 groups were not statistically significant. The BMI SDS of the subjects in the non-IGHD group was lower than that of the subjects in the IGHD group (P=0.023). Height SDS and distribution of PS did not differ between the 2 groups.

Clinical characteristics and auxological data of the subjects
2. Comparison of the SDS values of IGF-1 and IGFBP-3 based on CA, BA, and PS
Serum IGFBP-3 level was not measured in 11 patients of the non-IGHD group and 1 patient of the IGHD group. Thus, when analyzing IGFBP-3 values, 268 patients of the non-IGHD group and 30 patients of the IGHD group were analyzed. The IGF-1-SDS for CA and IGF-1-SDS for BA were lower among the IGHD subjects (-1.32±0.72 vs. -0.92±0.69 and -0.97±0.87 vs. -0.56±0.75, respectively, P<0.05) (Table 2, Fig. 1A). The IGFBP3-SDS for CA also was lower in the IGHD patients (-0.78±1.79 vs. -0.26±1.74, P<0.05) (Table 2, Fig. 1B). The IGF-1-SDS for PS, IGFBP-3-SDS for BA, and IGFBP-3-SDS for PS were lower in IGHD patients, but the differences were not significant.
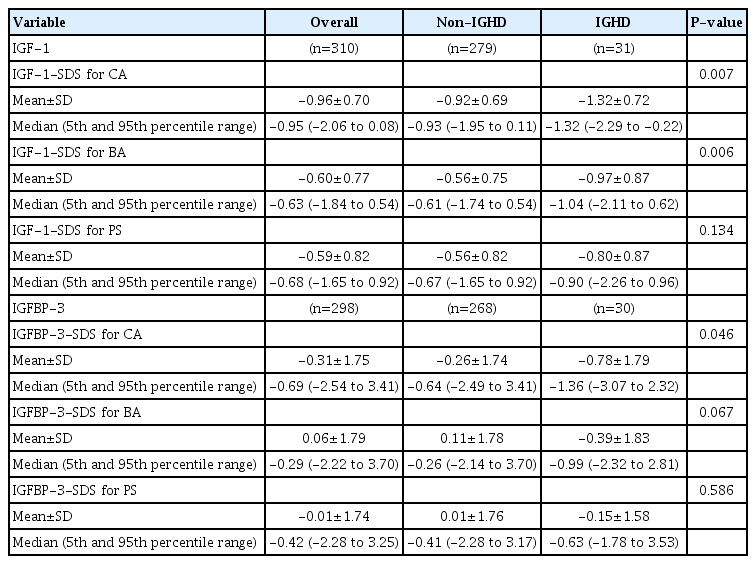
Comparison of the IGF-1 and IGFBP-3 levels

Comparison of diagnostic value of IGF-1 and IGFBP-3 for isolated growth hormone deficiency. (A) Box-plot chart of IGF-1. (B) Box-plot chart of IGFBP-3. IGF-1, insulin-like growth factor 1; IGFBP-3, insulin-like growth factor binding protein 3; CA, chronological age; BA, bone age; PS, pubertal status; SDS, standard deviation score.
3. Diagnostic value of IGF1-SDS and IGFBP-3-SDS levels for IGHD
In the IGHD group, IGF-1-SDS for CA, IGF-1-SDS for BA, and IGF-1-SDS for PS were normal in 24 (77.4%), 27 (87.1%), and 29 of the 31 subjects (93.5%), respectively. In the non-IGHD group, they were low in 12 (4.3%), 6 (2.1%), and 5 of the 279 subjects (1.8%), respectively.
The highest sensitivity was observed when IGF-1-SDS for CA and IGFBP-3-SDS for CA were applied (22.6% and 30.0%, respectively). The highest specificity and accuracy were found in IGF-1-SDS for PS (98.2% and 96.4%, respectively) and IGFBP-3-SDS for PS (94.4% and 92.6%, respectively). Groups with the highest PPV were IGF-1-SDS for BA and IGFBP-3-SDS for BA (10.9% and 5.1%, respectively). The highest NPV was measured in IGF-1-SDS for CA and IGFBP-3-SDS for CA (98.4% and 98.4%, respectively). Sensitivity increased in the order of PS<BA<CA for IGF-1-SDS and IGFBP-3-SDS for diagnosis of IGHD. Specificity increased in the order of CA<BA<PS for IGF1-SDS and IGFBP-3-SDS (Table 3).

Diagnostic value of IGF-1 and IGFBP-3 for the diagnosis of isolated growth hormone deficiency
4. Diagnostic performance of IGF-1-SDS and IGFBP-3-SDS for IGHD
When P-values were considered together, growth factors showing statistically significant diagnostic performance were IGF1-SDS for CA and IGF1-SDS for BA (AUC of 0.647 and 0.652, respectively, Fig. 2A). We analyzed the DeLong test of these 2 growth factors for comparing AUCs (P=0.825). Thus, there was no significant difference in diagnostic performance of IGF-1-SDS for CA and IGF-1-SDS for BA (Fig. 2B).
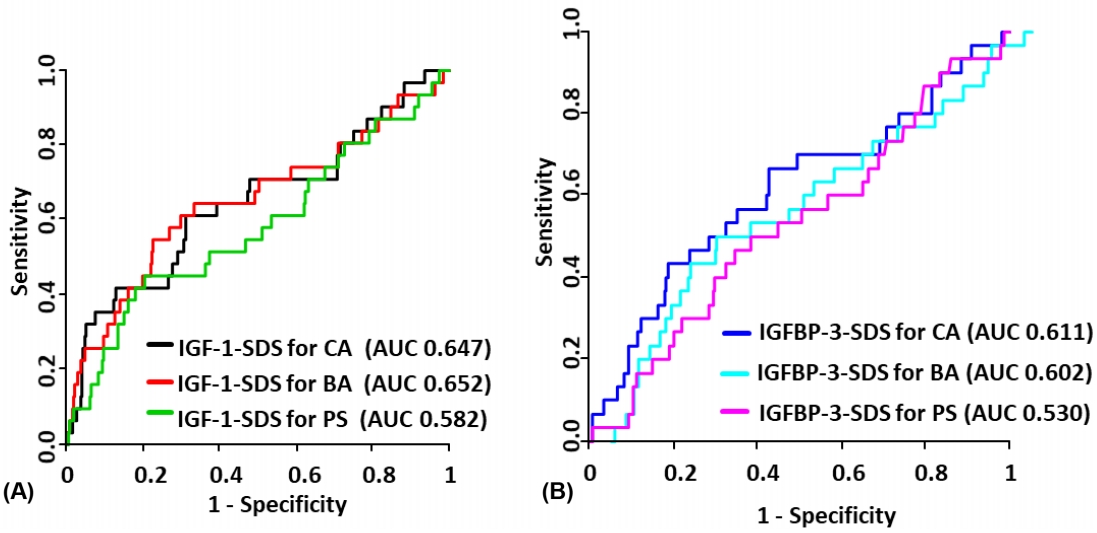
Diagnostic performance of IGF-1 and IGFBP-3 for isolated growth hormone deficiency. (A) ROC plot of IGF-1. (B) ROC plot of IGFBP-3. IGF-1, insulin-like growth factor 1; IGFBP-3, insulin-like growth factor binding protein 3; CA, chronological age; BA, bone age; PS, pubertal status; SDS, standard deviation score; ROC, receiver operator characteristic; AUC, area under the curve.
We also analyzed the ROC curves of height SDS, BA delay, and BMI SDS. The AUC values of ROC curves for height SDS, BA delay, and BMI SDS were 0.605, 0.518, and 0.625, respectively (P for AUC=0.062, P for AUC=0.738, and P for AUC=0.028, respectively). We constructed multivariable diagnostic models including height SDS, BMI SDS, BA delay, and growth factors. These models showed a higher AUC compared with all other previous models (Table 4).
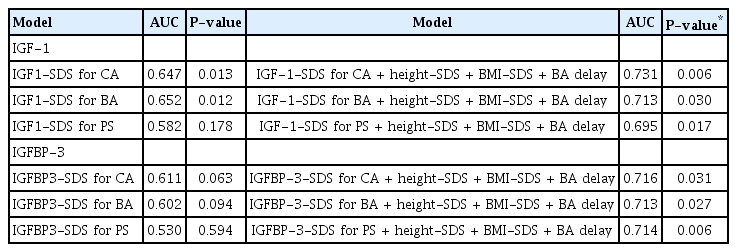
Diagnostic performance of the multivariable models for the diagnosis of isolated growth hormone deficiency
Discussion
This study aimed to compare the discriminatory performance of growth factor levels investigated by CA, BA, and PS for diagnosis of IGHD. The greatest sum of specificity and sensitivity and the highest AUC were exhibited in IGF-1-SDS for CA. The IGF-1-SDS for CA and IGFBP-3-SDS for CA had the highest sensitivity, suggesting their usefulness as a screening test. All IGF-1-SDS and IGFBP-3-SDS values showed high specificity (>85%) but low sensitivity (≤30%). This indicates that the serum values of IGF-1 and IGFBP-3 are more powerful in diagnosing IGHD when the SDS values are low. The specificity of IGF-1-SDS for PS was high at 98.2%. This strongly suggests that short children whose IGF-1-SDS and/or IGFBP-3-SDS are less than -2 have a high probability of having IGHD. Although not completely substitutable for the GH stimulation test, IGF-1 testing might aid in clinical confirmation of IGHD.
According to Inoue-Lima et al. [17] sensitivity of IGF-1-SDS for CA, IGF-1-SDS for BA, and IGF-1-SDS for PS for diagnosis of IGHD was 91.3%, 72.2%, and 63.6%, respectively, and specificity of IGF-1-SDS for CA, IGF-1-SDS for BA, and IGF-1-SDS for PS was 69.5%, 90.1%, and 93.3%. This is a higher sensitivity than found in the present study. According to Cianfarani et al. [18] sensitivity of IGF-1-SDS for CA and IGFBP-3-SDS for CA was 73% and 30%, respectively, and specificity of IGF-1-SDS for CA and IGFBP-3-SDS for CA was 95% and 98%. In that article, IGF-1-SDS for CA sensitivity was higher than that in the present study, whereas IGFBP-3-SDS for CA sensitivity was similar. Felicio et al. [19] stated that sensitivity and specificity of IGF-1-SDS for CA were 20% and 84.6% respectively, similar to our results. They also reported gain in sensitivity (36%) and loss in specificity (57.7%) if the cutoff SDS value was adjusted to -1.
There are some factors that explain the low sensitivity of IGF-1-SDS and IGFBP-3-SDS in our study. First, an appropriate cutoff value for SDS is a crucial factor in determining the diagnostic validity. The highest AUCs for IGF-1-SDS for CA, IGF-1-SDS for BA, and IGF-1-SDS for PS were found at SDS cutoff values of -1.23, -1.03, and -1.17, respectively. The sensitivity and specificity of each changed to 61.3% and 68.5%, 51.6% and 77.5%, and 41.9% and 79.6%, respectively. Due to the reduced specificity mentioned above, using the optimal cutoff value of each growth factor is less beneficial. Since each optimal cutoff value is different among 6 growth factor levels, it is less practical when applied in clinical practice.
Second, in addition to GH, there is a multitude of other hormones such as insulin, thyroid hormones, glucocorticoids, and sex steroids that influence production of IGF-1 and IGFBP-3. Also, serum IGF-1 and IGFBP-3 levels are affected by multiple environmental and epidemiologic factors such sex, age, ethnicity, PS, nutritional status, liver insufficiency, hypothyroidism, diabetes mellitus, and systemic illness [20]. Therefore, measurements of IGF-1 and IGFBP-3 alone are insufficient to diagnose IGHD.
Last, we have to consider the poor diagnostic performance of the provocative GH test. A high false positive rate for the provocative GH test is a known limitation of the assay [21,22]. The false positive rate of insulin tolerance and clonidine tests were as high as 43% and 33%, respectively [23]. Previous studies have shown that, even in normal children, GH peak level can be less than 10, 7, or even 5 ng/mL [24,25]. Therefore, GH-sufficient children might have been included in the IGHD group of our study, which could be related to the low sensitivity of IGF-1 and IGFBP-3.
Measurement of spontaneously secreted GH is the most accurate assessment of GH physiology or pathophysiology. However, this method usually is restricted to research use. Therefore, various auxological parameters including height velocity, height SDS, BMI SDS [18,20], radiographic assessment of BA, measurement of IGF-1 and IGFBP-3, provocative GH testing, cranial MRI, and, in certain cases, genetic testing should be taken into account for proper interpretation of GH secretion status [26]. In the present study, we proposed a combination model that incorporated growth factor level, height SDS, BMI SDS, and BA delay. The AUC value of this model showed statistically significant improvement compared with other single-variable models.
We could not include height velocity as a clinical factor for diagnosis of IGHD, though it has long been considered an important factor in evaluation of short stature. However, according to Hintz [27] there was no difference in growth velocity between the patients with GHD and short stature without GHD. Horner et al. [28] stated that short-stature children without GHD also show a growth lag early in life, which eventually leads to short terminal stature. Although measurement of height velocity before GH provocative testing is important, it is not always possible because height measurement is sometimes unavailable, and indirect procurement of height data from parents or caregivers could be inaccurate. Additionally, when children hit puberty, the growth rate will be faster than 4 cm/yr even if they have IGHD. Therefore, these various features of height velocity should be considered when this factor is incorporated in diagnosis of GHD.
Our result of BMI SDS in the IGHD group was higher than that of the non-IGHD group. We think this is a valid result because IGHD group patients are prone to weight gain compared to the normal population. According to Savastano at el. [29] malnutrition negatively affects production of IGF-1 and IGFBP-3, and hyper-nutrition is positively correlated with production of IGF-1 and IGFBP-3. However, correlation between BMI SDS and growth factor is not fully established. Therefore, the impact of differences in BMI SDS on IGF-1 and IGFBP-3 levels could not be investigated. This is a limitation of our study.
In conclusion, IGF-1-SDS for CA, instead of IGF-1-SDS for BA or PS, could be used as a standard variable for IGHD screening. The sufficiently high specificity of IGF-1-SDS for PS suggests that this value is a useful tool to facilitate identification of IGHD. Further studies are warranted to improve accuracy in diagnosis of IGHD.
Notes
Ethical statement
This study was approved by the Institutional Review Board of Yeouido St. Mary's Hospital, College of Medicine, The Catholic University of Korea (No. XC20RIDI0004). Need for written informed consent by the patients was waived due to the retrospective nature of this study
Conflicts of interest
No potential conflict of interest relevant to this article was reported.