 |
 |
- Search
| Ann Pediatr Endocrinol Metab > Volume 25(4); 2020 > Article |
|
Abstract
Purpose
Methods
Results
Notes
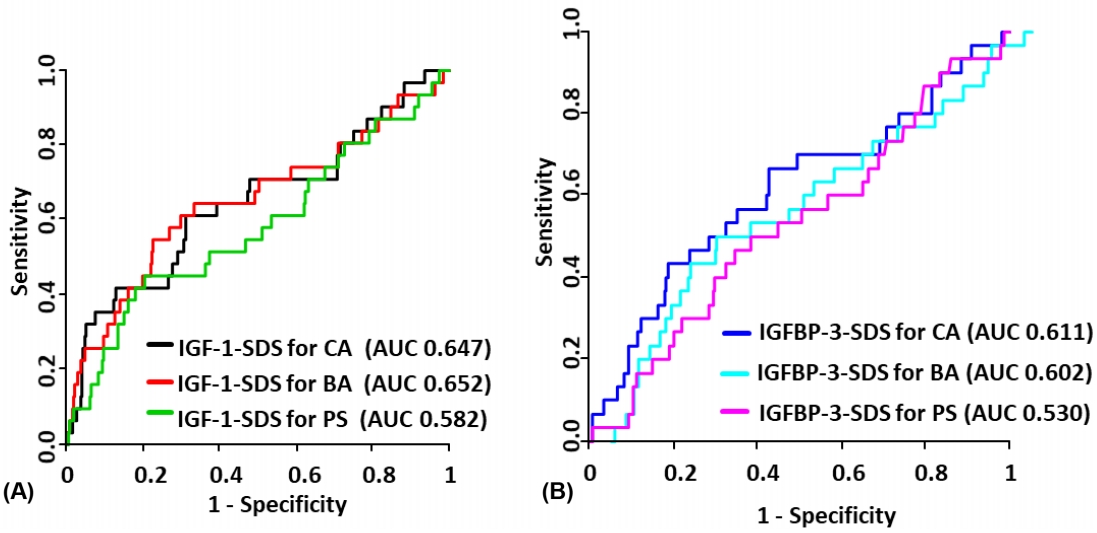
Fig.┬Ā1.

Fig.┬Ā2.

Table┬Ā1.
Values are presented as number (%) for categorical variable unless otherwise indicated.
P-value for difference were determined by using chi-square or Wilcoxon rank sum test.
IGHD, isolated growth hormone deficiency; MPH, midparental height; CA, chronological age; BA, bone age; SDS, standard deviation score; BMI, body mass index; SD, standard deviation.
Table┬Ā2.
P-value for difference were determined by using Wilcoxon rank sum test.
IGF-1, insulin-like growth factor 1; IGFBP-3, insulin-like growth factor binding protein 3; IGHD, isolated growth hormone deficiency; SDS, standard deviation score; SD, standard deviation; CA, chronological age; BA, bone age; PS, pubertal status.
Table┬Ā3.
IGF-1, insulin-like growth factor 1; IGFBP-3, insulin-like growth factor binding protein 3; IGHD, isolated growth hormone deficiency; PPV, positive predictive value; NPV, negative predictive value; SDS, standard deviation score; CA, chronological age; BA, bone age; PS, pubertal status.
*For the assessment of the PPV and NPV, we considered a maximum prevalence of IGHD of 2%.
Table┬Ā4.
| Model | AUC | P-value | Model | AUC | P-value* |
|---|---|---|---|---|---|
| IGF-1 | |||||
| ŌĆāIGF1-SDS for CA | 0.647 | 0.013 | IGF-1-SDS for CA + height-SDS + BMI-SDS + BA delay | 0.731 | 0.006 |
| ŌĆāIGF1-SDS for BA | 0.652 | 0.012 | IGF-1-SDS for BA + height-SDS + BMI-SDS + BA delay | 0.713 | 0.030 |
| ŌĆāIGF1-SDS for PS | 0.582 | 0.178 | IGF-1-SDS for PS + height-SDS + BMI-SDS + BA delay | 0.695 | 0.017 |
| IGFBP-3 | |||||
| ŌĆāIGFBP3-SDS for CA | 0.611 | 0.063 | IGFBP-3-SDS for CA + height-SDS + BMI-SDS + BA delay | 0.716 | 0.031 |
| ŌĆāIGFBP3-SDS for BA | 0.602 | 0.094 | IGFBP-3-SDS for BA + height-SDS + BMI-SDS + BA delay | 0.713 | 0.027 |
| ŌĆāIGFBP3-SDS for PS | 0.530 | 0.594 | IGFBP-3-SDS for PS + height-SDS + BMI-SDS + BA delay | 0.714 | 0.006 |
AUC, area under curve; IGF-1, insulin-like growth factor 1; IGFBP-3, insulin-like growth factor binding protein 3; IGHD, isolated growth hormone deficiency; SDS, standard deviation score; CA, chronological age; BA, bone age; PS, pubertal status; BMI, body mass index.
P-value indicates the significance level for AUC=0.5
References
- TOOLS
- Related articles in APEM


