


Introduction
Childhood obesity has become a major public health issue, and the numbers of obese children and adolescents continue to increase [1]. Obesity is now recognized as a disease because growing evidence has revealed its associations with various metabolic complications [2]. In addition, excess adiposity is known to influence multiple aspects of pubertal development, such as the timing of pubertal initiation and pubertal hormonal parameters [3]. However, the relationships between these factors remain somewhat inconsistent.
Previous studies have suggested that differences in adiposity distribution may exert different effects on metabolic complications. For example, central obesity is associated with visceral fat accumulation and is more commonly associated with impaired glucose and lipid metabolism, compared to subcutaneous fat accumulation [4]. In addition, even among nonobese individuals, visceral fat accumulation is correlated with glucose intolerance, dyslipidemia, and hypertension [5]. However, few studies have evaluated the association between pubertal development and visceral fat accumulation. Thus, the present study evaluated visceral adiposity among Korean girls with early pubertal development, and its associations with their metabolic and hormonal parameters, in order to understand the relationship between sexual maturation and obesity in the context of precocious puberty.
Materials and methods
1. Study population and design
We retrospectively analyzed data from 128 girls who were <8 years old and had visited the Yonsei University Gangnam Severance Hospital between October 2013 and November 2016 for evaluation of early breast development (objective breast budding that exceeded Tanner stage II). The subjects had undergone sonographic measurement of visceral fat thickness (VFT) and subcutaneous fat thickness (SFT). We also reviewed their gonadotropin-releasing hormone (GnRH) stimulation test results and defined central precocious puberty (CPP) as peak luteinizing hormone (LH) concentrations of Ōēź5 IU/L and non-CPP as peak LH concentrations of <5 IU/L. We excluded patients who underwent testing under nonfasting condition, had underlying diseases that might interrupt normal pubertal development, or had incomplete hormone test results. A total of 54 patients were included in the CPP group and 18 patients were included in the non-CPP group. This study's protocol was approved by the Institutional Review Board of Yonsei University Gangnam Severance Hospital (approval number: 3-2017-0178).
2. VFT and SFT measurements
Ultrasonography was performed to measure VFT and SFT using a high-resolution ultrasonographic system (SA 9900, Medison, Seoul, Korea). VFT was defined as the fat tissue thickness between the linea alba and the aorta, while SFT was defined as the fat tissue thickness between the skin-fat interface and the linea alba [6]. Transverse scanning was performed to measure the maximum VFT and SFT using 3.5 MHz and 7.5 MHz probes, respectively. Both parameters were measured at 1 cm above the umbilicus by the same pediatric radiologist.
3. Clinical and laboratory data
Height and weight were measured without shoes but with light clothing, and the measurements were rounded up to nearest 0.1 cm and 0.1 kg. We calculated the standard deviation scores for height, weight, and body mass index (BMI) based on the 2007 Korean National Growth Charts [7]. Patients with BMI percentiles above the 85th percentile were labeled as being overweight, and patients with BMI percentiles below the 85th percentile were labeled as having normal weight. Breast development was assessed by a single pediatric endocrinologist through visual inspection and palpation, and Tanner staging was used to grade pubertal stage (ranging from grade I [prepubertal] to grade V [adult]) [8].
Blood samples had been taken to analyze lipid profiles, serum glucose, insulin, insulin resistance index, and baseline sex hormones (LH [IU/L], estradiol [pg/mL], sex hormonebinding globulin, free estradiol index, and insulin-like growth factor 1 [IGF-1]). The homeostasis model assessment-insulin resistance (HOMA-IR) score was used as an indicator of insulin resistance, and was calculated as (fasting plasma insulin├Śfasting plasma glucose)/405 [9]. Bone age was assessed using radiography of the left hand. The patients' provided blood samples that were obtained at 0, 30, 60, 90, and 120 minutes after an injection of GnRH (100 ╬╝g of Relefact, Sanofi-Aventis, Paris, France), and their levels of LH were subsequently measured [10]. A peak LH level of 5 IU/L was used as the cutoff for identifying a pubertal response [10].
4. Statistical analysis
All data were analyzed using IBM SPSS Statistics ver. 23.0 (IBM Co., Armonk, NY, USA). Associations between continuous variables were evaluated using Pearson correlation coefficient. Intergroup comparisons of nonparametric data sets were performed using the Kruskal-Wallis test. Multiple regression analysis was used to verify the associations between VFT, SFT, BMI, and age at the onset of thelarche. Differences were considered statistically significant at a P-value of <0.05.
Results
1. Baseline characteristics
The baseline characteristics of the CPP and non-CPP groups are shown in Table 1. Among the 72 patients, 54 patients (75%) were CPP and 18 patients (25%) were non-CPP. Compared to the CPP group, the non-CPP group had significantly higher weight SDS (0.71┬▒0.78 vs. 1.18┬▒0.09, P=0.04) and BMI SDS (0.27┬▒0.90 vs. 1.00┬▒1.17, P=0.008). The CPP group had significantly higher baseline levels of LH (1.27┬▒1.47 IU/L vs. 0.58┬▒0.89 IU/L, P=0.023), estradiol (16.78┬▒21.12 pg/mL vs. 8.06┬▒7.78 pg/mL, P=0.001), and IGF-1 (310.15┬▒109.01 ng/mL vs. 231.88┬▒51.03 ng/mL, P<0.001). There were no significant differences between the two groups in their values for VFT (2.22┬▒0.79 cm vs. 2.74┬▒1.47 cm, P=0.169) and SFT (1.18┬▒0.98 cm vs. 1.33┬▒0.60 cm, P=0.554).
2. Comparing the CPP and non-CPP groups based on BMI percentiles
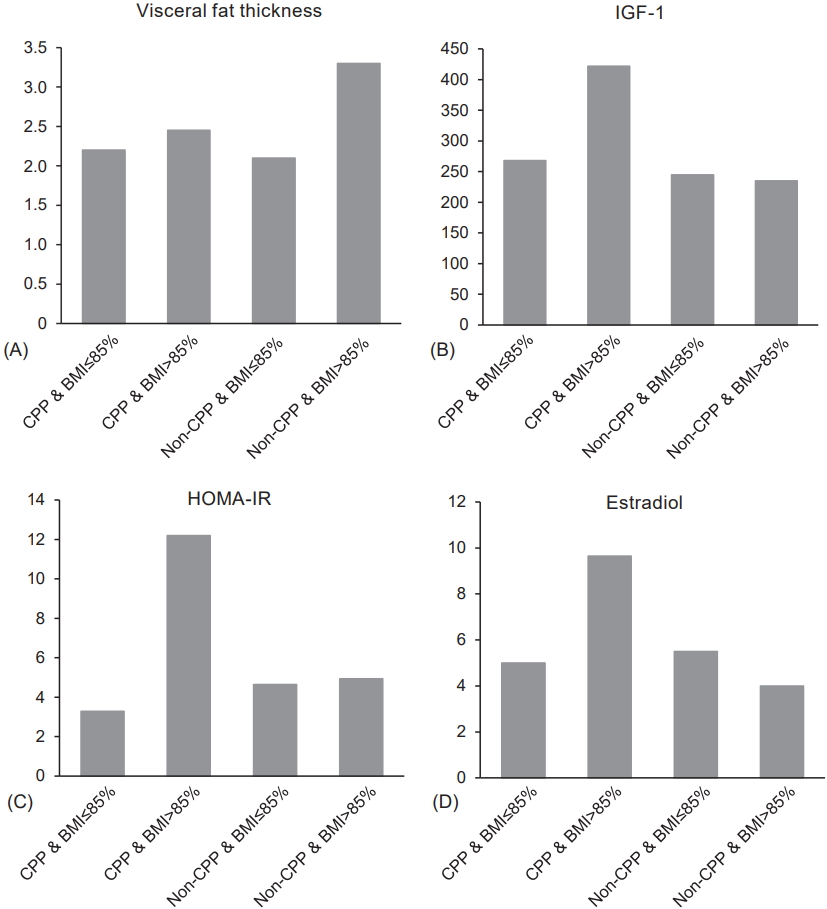
The patients in the CPP and non-CPP groups were also categorized into overweight and normal weight groups. The overweight patients in the CPP group exhibited trends towards higher values for the difference between bone age and chronological age, baseline LH, peak LH, estradiol, free estradiol index, insulin, IGF-1, and HOMA-IR (Table 2, Fig. 1). Furthermore, overweight CPP group exhibited higher HOMAIR and IGF-1 compared normal weight CPP subjects; however, non-CPP subjects did not show significant difference of HOMA-IR and IGF-1 between overweight and normal weight groups. Moreover, compared to the normal weight CPP group, the overweight CPP group exhibited nonsignificantly higher values for baseline and peak LH (Table 2). No differences were observed when we compared the overweight and normal weight patients in the non-CPP group.
The overweight patients in the CPP and non-CPP groups exhibited trends towards higher VFT and SFT values, compared to their normal weight counterparts. Overweight patients in the non-CPP group had significantly higher VFT, compared to overweight patients in the CPP group (3.3 cm vs. 2.45 cm, P<0.05). No significant differences were observed when we compared normal weight patients in the CPP and non-CPP groups (Table 2).
3. Relationship between age onset of thelarche and adiposity parameters
Table 3 shows the Pearson correlation coefficients for the relationships between age at the onset of thelarche and multiple adiposity parameters. Age at the onset of thelarche was negatively correlated with VFT (r=-0.307, P<0.05) and SFT (r=-0.255, P<0.05). In addition, BMI SDS was negatively but nonsignificantly correlated with age at the onset of thelarche (r=-0.107, P=0.373). In the multiple linear regression analysis, only VFT was independently associated with age at the onset of thelarche (╬▓=-0.310, P<0.05) (Table 4).
Discussion
Previous studies regarding obesity and pubertal development have demonstrated that greater BMI is associated with an increased likelihood of early pubertal development [11-13]. However, the effect of fat distribution on pubertal development remains unclear. Although there is an overlap between central obesity measures and BMI-based obesity, measuring BMI does not provide useful information regarding fat distribution [14]. Pattern of fat distribution, rather than obesity, has been reported as a more important factor for predicting metabolic and cardiovascular morbidity and multiple methods have been used for assessment [15]. By far, computed tomography is the most accurate tool, but the risk of radiation exposure and relatively high cost limits its routine use in clinics [16]. Other methods such as skinfold thickness, waist circumference, waist-hip ratio are also commonly used clinical tool for assessing pattern of fat distribution. However, each of those methods is known for their own limitations. Skinfold thickness has its limitation associated with the caliper method and may pose difficulty in severely obese subjects [15]. Waist circumference and waist-hip ratio are widely used in adults, but shows inconsistent correlation with visceral fat in children [15,17]. In contrast, ultrasound has shown to be a reliable, convenient, and reproducible method for assessing fat distribution according to previous studies in children [15,16,18]. Also, in girls with early puberty, ultrasonograhic evaluation offers additional benefit of examining uterus and ovary in evaluating the cause of early puberty. Therefore, we used ultrasound for assessing the central obesity of girls with early puberty.
Previous studies have attempted to clarify the effects of central obesity on pubertal maturation, as Chen et al. [19] found that increased central obesity, based on the waist-to-height ratio, was associated with earlier breast development in children aged 6ŌĆō12 years. Mechanisms underlying the process involves insulin resistance, hyperinsulinemia, and leptin [20]. Insulin resistance caused by obesity leads to compensatory hyperinsulinemia which subsequently causes decrease in sex hormone binding globulin and increased estrogen level [20]. Also, increased aromatization from excess adipose tissue results in increased estrogen level [21]. Moreover, increased leptin causes central activation of GnRH and gonadotropin secretion and direct stimulation of LH and FSH release [22,23]. However, leptin alone may not be sufficient to initiate puberty, as Ahmed et al. [24] reported that leptin administration did not consistently advance puberty. Furthermore, Roemmich et al. [25] proposed that insulin resistance may contribute to pubertal maturation by interfering with leptin signaling, which could cause additional weight gain and accelerated pubertal growth. Thus, to our current knowledge obesity seems to have influence on pubertal maturation.
In the present study of 72 girls, ultrasonographically measured VFT showed good correlation with BMI (r=0.485). Furthermore, VFT was positively correlated with earlier thelarche onset, indicating that subjects with increased VFT had earlier onset age of breast development. We further speculated that increasing trend of VFT would be shown as pubertal changes progress; however, our results have shown non-CPP groups having thicker VFT than CPP groups, although not statistically significant. The reason for such result is not clear to us, but it can be explained by the fact that non-CPP group had significantly higher BMI SDS compared to CPP subjects (1.00┬▒1.17 vs. 0.27┬▒0.90, P=0.008). Considering the normal physiologic weight gain during pubertal changes and earlier studies that have found CPP patients having higher BMI compared to early puberty patients [26], our conflicting finding to previous research may be due to small sample size which may have created a sampling bias. Another possible explanation is the effect of serum sex steroid concentrations that might have affected on body fat distribution. Puberty normally begins with gonadotropin-driven ovarian estrogen production and estrogen levels progressively increases as the hypothalamic-pituitary-gonadal axis matures. The amount of visceral fat is thought to be modulated by the balance between estrogens and androgens, and estrogens may contribute to decreasing visceral fat accumulation by downregulating androgen receptors [27]. In our study, CPP group had significantly higher estradiol compared to non-CPP group, and high levels of estradiol in CPP group may have had influence on lower VFT compared to non-CPP group. De Ridder et al.ŌĆÖs cross-sectional data stating the high estrogen concentrations among early pubertal girls correlating with lesser central fat verifies with our findings [28]. Moreover, pubertal increases in sex steroid secretions can stimulate growth hormone (GH) secretion, which protects against increased visceral adiposity, as Roemmich et al. [29] and Bj├Črntorp [30] found that GH treatment selectively reduces the abdominal visceral fat of children with GH deficiency. Likewise, CPP group in our study had significantly higher IGF-1 level compared to non-CPP group, and the profoundly increased IGF-1 may have had a role in protecting against gaining visceral fat in CPP group. As pubertal maturation induces more distinctive changes in hormones such as estradiol and IGF-1, it is speculated that visceral fat gain may slow down due to the hormonal effects. However, many other factors such as ethnicity, genetic background, degree of physical activity, and metabolic factors can affect visceral adiposity. Therefore, research with larger sample is needed to examine the influence of changing sex hormone concentrations on visceral adiposity.
In regard to metabolic parameters of the study subjects, we revealed that overweight CPP subjects had the highest insulin resistance among the 4 groups (normal weight CPP, normal weight non-CPP, overweight CPP, and overweight non-CPP). Previous cross-sectional and longitudinal studies have reported that pubertal changes are related to increased insulin resistance [31]. Moran et al. [31] in their cross-sectional study, stated that insulin resistance was highest in Tanner stages III and IV, and it return to normal level as approaching Tanner stage V. Also, in a longitudinal study by Ball et al. [32], similar result was found, demonstrating the increased insulin resistance in midpuberty and recovery in the end of puberty. Furthermore, overweight children are more prone to insulin resistance than normal weight children, and several studies have stated that obese children do not recover insulin sensitivity at the end of puberty [33]. In our study, overweight CPP group showed distinctively higher insulin resistance even compared to overweight non-CPP group. Such finding verifies the physiologic increase in insulin resistance during puberty and negative effect of obesity in insulin resistance in children with CPP.
Insulin resistance during pubertal maturation seems to be a physiologic change. Mechanisms underlying such phenomenon mainly involves GH and IGF-1 which is normally increased during puberty [34]. Children who are treated with recombinant GH for idiopathic short stature showed transient insulin resistance during the course of treatment [35]. It is hypothesized that GH is associated with changes of phosphoinositide-3 kinase, the rate limiting enzyme in the metabolic insulin signaling pathway [36]. Thus, pubertal increase in GH is possible cause of insulin resistance in CPP groups. Independently of puberty, obesity itself is known for having negative impact on insulin resistance by the complex mechanisms involving leptin, inflammatory cytokines, and free fatty acids produced by adipocytes [37]. Thus, obese children during pubertal change are more insulin-resistant than lean children, as verified by our study's result.
There are several limitations and subjects for future improvements in this study. First of all, present study's retrospective design and small sample size (54 patients with CPP and 18 patients with non-CPP) can be associated with risks of selection bias. Also, subjects in non-CPP group whose peak LH level was near 5 IU/L may have a significant overlap with CPP group. Therefore, stratifying the result of LHRH stimulation test and comparing the groups of profoundly low and high peak LH result may provide more significant result; however, we were not able to do such analysis due to limited number of samples. Moreover, the present study did not consider some factors that may influence puberty and obesity, such as physical activity, nutritional status, and leptin level in biochemical analysis. Finally, the present study evaluated only the patients with pubertal changes. For clearer results, ultrasound measurement of central obesity, metabolic profiles, and hormonal parameters of prepubertal children for comparison of pubertal children is required. Nevertheless, this study has found usefulness of ultrasound measurement of VFT and its correlation with early breast development of girls. Future studies should include large study samples through longitudinal study with additional associated factors regarding precocious puberty.
In conclusion, among girls with early breast development, ultrasonographically measured VFT was a useful index of central obesity. Also, increased VFT was associated with early breast development in girls. However, VFT was not higher in subjects with CPP than non-CPP, and was not significantly correlated with insulin resistance. Multiple mechanisms may be involved in the association of central obesity with hormonal changes in the pubertal state. Therefore, further large, longitudinal studies of children throughout their pubertal transition or children with precocious puberty throughout the courses of treatment are needed to clarify the relationship.