Association of birth weight with risk of diabetes mellitus in adolescence and early adulthood: analysis of the Indonesian Family Life Survey
Article information

Abstract
Purpose
We aimed to investigate the association of birth weight with the risk of diabetes mellitus in adolescence and early adulthood in the Indonesian population.
Methods
This study analyzed data from the Indonesian Family Life Survey, a longitudinal study of the Indonesian population with repeated measurements at 3 time points (1997, 2007, and 2014). The subjects observed were children aged 0–59 months in 1997, who were 10–15 years old in 2007, and 17–22 years in 2014. We performed a generalized linear model to investigate the association between birth weight at baseline and the level of hemoglobin A1c (HbA1c) at the 2 follow-up periods. We adjusted the association for the characteristics of the children, parents, and household.
Results
The mean±standard deviation level of HbA1c was 7.35%±0.95% in 2007 and decreased to 5.30%±0.85% in 2014. The crude β (95% confidence interval [CI]) of the association between birth weight and HbA1c was 0.150 (-0.076, 0.377) in 2007 and 0.146 (-0.060, 0.351) in 2014. After adjustment for the sociodemographic characteristics of the children, parents, and confounding factors, the adjusted β (95% CI) was 1.12 (0.40–1.85) in 2007 and 0.92 (0.35–1.48) in 2014. The HbA1c of the parents, father’s employment status, percentage of food expenditure, and underweight were the covariates that had significant associations with HbA1c.
Conclusions
HbA1c level was higher in adolescence than in early adulthood. Birth weight was associated with HbA1c level in both periods. The HbA1c of the parents, father’s employment, percentage of food expenditure, and underweight partly explained the association between birth weight and the HbA1c level.
Highlights
· Birth weight was positively associated with hemoglobin A1c (HbA1c) levels during adolescence and young adulthood.
· HbA1c level was higher during adolescence than in young adulthood.
· Besides genetics, sociodemographic factors play a part in the level of HbA1c.
Introduction
Diabetes mellitus (DM) is a global health problem, particularly in developing countries, where the prevalence is steadily increasing and is estimated to continue rising until 2035. In Indonesia, according to the 2018 National Health Survey report, the prevalence of DM in the population aged ≥15 years was 2.0% [1]. This rate had increased compared to that documented in the 2013 National Survey, which was 1.5%. The 2013 survey reported that 36.6% of the Indonesian population had impaired fasting blood glucose and was at risk of DM [2].
The 'fetal origins hypothesis' is associated with developmental health, disease, and environmental status of the individual during the fetal period and affects their quality of health and incidence of degenerative diseases in adulthood. It is well established that pregnant women with poor nutritional status have small fetuses. If the fetus who is exposed to intrauterine hunger is born with low birth weight, this may lead to compensatory adaptation mechanisms in the outer-uterine environment after birth. This incompatibility may become a risk factor for noncommunicable diseases, including type 2 DM, hypertension, obesity, dysfunction of lipid metabolism, and cardiovascular disease. An incompatibility may result that can become a risk factor for noncommunicable diseases, including type 2 DM, hypertension, obesity, dysfunction of lipid metabolism, and cardiovascular disease [3]. Extensive epidemiological studies have shown a linear relationship between birth weight and obesity and noncommunicable diseases later in life. In a study with various populations and age groups, it was shown that individuals born with low and very high birth weights are at risk of developing DM in adulthood [4].
One of the parameters for measuring DM is hemoglobin A1c (HbA1c), which measures glucose metabolism in the blood, indicating the average blood glucose level over a period of 2 to 3 months. Metabolically, in its presence, glucose with react with hemoglobin and other proteins to form glycolytic compounds. An advantage of measuring HbA1c in diabetic individuals is its higher preanalytical stability compared to other diagnostic tests for diabetes, which are fasting plasma glucose (FPG) and oral glucose tolerance test (OGTT) [5].
In a previous study conducted in Indonesia (the Tanjung Sari cohort study), a history of low birth weight was associated with impaired glucose tolerance in adolescents aged 12–14 years. The study recommended that the prevention of DM should focus on improving the nutritional status of mothers and newborns [6]. Nevertheless, whether impaired glucose tolerance continues until adulthood and is reflected in the HbA1c level remain unknown. Thus, in the present study, we investigated the association between infant birth weight and HbA1c level in adolescence and early adulthood.
Materials and methods
1. Data collection
This study used secondary data from the longitudinal study of the Indonesia Family Life Survey (IFLS). The measurements were obtained at 5 time points: 1993, 1997, 2000, 2007, and 2014. According to the IFLS data user manual, a sample of 7,224 households was obtained from 13 of 26 provinces in Indonesia, which were located on the islands of Java, Sumatra, Bali, West Nusa Tenggara, Kalimantan, and Sulawesi. The population selected as the IFLS data sample represented approximately 83% of the total Indonesian population. The survey recorded data on fertility, family planning and contraception, infant and child health, education, migration, employment, and socioeconomic and health status of the population [7]. The survey provided data at the individual and household levels. The information was linked to the local health facility and community, enabling investigation of the impact of public policies on the lives of respondents, as well as the impact of social, economic, and environmental changes on population health [8].
This observational study used longitudinal data from IFLS. Data collection began when the children were aged 0–59 months in 1997, and they were followed until they were aged 10–15 years in 2007, and 17–22 years in 2014. The households included had complete data on birth weight and HbA1c values at all study time points. In addition, we only included children with complete data on parental and household characteristics.
2. HbA1c
According to the American Diabetes Association and the World Health Organization (WHO), the HbA1c level is a criterion in the diagnosis of DM [9]. In this study, which employed data from IFLS, the HbA1c levels were measured with the dried blood spot (DBS) method, involving collection of a blood drop, usually from the fingertip, onto a special paper and then allowing it to dry before analysis. DBS is used in IFLS because it is easier to obtain a sample compared with venous blood samples. Moreover, DBS can be stored long term in stable clotting conditions. HbA1c measurement was chosen for IFLS because the respondents were not required to fast in advance, unlike fasting blood glucose measurement. An individual is diagnosed with DM if they have an HbA1c level ≥6.5% and with pre-DM in the HbA1c range from 5.7% to 6.4% [5].
3. Nutritional status
Body weight, height, and waist circumference were measured based on standardized anthropometric methods by trained operators. The body mass index (BMI) was calculated as weight divided by the square of height (kg/m2). Overweight/obesity in children is defined as a BMI-for-age z-score (BAZ) > 1 standard deviation (SD) from the average. In addition to BMI-for-age, other measures of nutritional status in children were recorded, such as weight-for-age, height-for-age, and weight-for-height z-scores.
In adults, overall obesity is defined according to the WHO BMI reference >24.99 kg/m2 [10]. Abdominal obesity is defined as a waist circumference >90 cm in men and >80 cm in women [11]. Birth weight in infants is categorized as low (<2,500 g) or normal (>2,500 g).
4. Sociodemographic and lifestyle variables
The IFLS collected information on the characteristics of children and their parents. The characteristics included sex, age, education (high school graduate or higher or junior high school graduate or lower), occupation, household location (urban or rural), household size (nuclear or extended family), per capita expenditure, and food expenditure.
Physical activity was recorded as the intensity, duration, and frequency of exercise. A moderate-to-intense exercise for at least 30 minutes, 5 days per week or more, was considered physically active. Parental smoking habits were categorized as smoking or not smoking. All data were obtained through interviews using the IFLS questionnaire, which is described elsewhere.
5. Data analysis
Statistical analyses were conducted using Stata 15 (StataCorp LLC, College Station, TX, USA). The dependent variable in this study was the risk of DM in adolescence and early adulthood, as observed by the levels of HbA1c in 2007 and 2014. The primary independent variable was the birth weight of children aged 0–59 months in 1997.
To describe the characteristics of the population, we performed univariate data analysis and presented the characteristics as the mean (SD) or median (interquartile range) for continuous variables or as percentages (%) for categorical variables. We then performed bivariate analysis to examine the associations of each individual, parent, lifestyle, and sociodemographic characteristic with the levels of HbA1c in 2007 and 2014. We included the significant associations/covariates in the final regression model and adjusted them as confounding factors. In addition, as growing evidence showed that growth stunting in childhood was associated with an increased risk of degenerative and metabolic diseases, such as type 2 DM [12-14], we added the interaction term between birth weight and height-for-age z-score in the multivariate regression models. This approach assessed whether low birth weight in combination with stunting (short for age) increases the risk of diabetes.
We performed a generalized linear model to examine the association of birth weight with the level of HbA1c during the 2 follow-up points (2007 and 2014) separately. We created 2 models: model 1, which measured the association between the birth weight at baseline (1997) and the HbA1c when the children were aged 10–14 years (2007), and model 2, which measured the association between the weight at baseline and the HbA1c level at 17–22 years (2014). A P-value <0.1 indicated a tendency, while a P-value <0.05 with a 95% confidence interval (CI) was considered statistically significant.
6. Data permission and ethical clearance
This study received approval from the RAND Corporation, the institute that conducted the survey and owned the IFLS data. The IFLS survey was reviewed and approved by the Institutional Review Board at the University of Gadjah Mada (ethical clearance number s0064-06-01-CR01).
Results
1. Descriptive characteristics
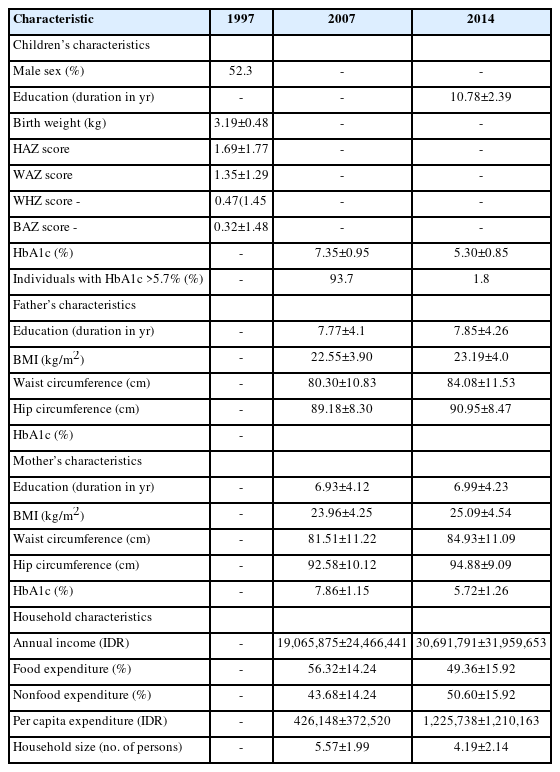
The mean±SD of infant birth weight at baseline measurement in 1997 was 3.19±0.48 kg. The proportion of infants who were born with low birth weight (<2.5 kg) was 4.2%. There were slightly more boys (52.3%) than girls (47.7%) in the study p opulation (Table 1). More detailed nutritional status measurements of the infants in 1997 are provided in Supplementary Table 1.
Descriptive characteristics of the population
At the first follow-up measurement in 2007, the mean±SD level of HbA1c was 7.35%±0.95%. The majority of subjects (92.7%) had an HbA1c level higher than the pre-DM cutoff of >5.7%. According to the BMI stratification, 13.6% of individuals in the population were underweight, 75.6% had normal weight, and 10.8% were overweight/ obese. At the second follow-up in 2014, the mean HbA1c level dropped to 5.30%±0.85%. The proportions of subjects who were underweight, normal weight, and overweight were 17.8%, 68.3%, and 13.9%, respectively (Table 1, Supplementary Table 2).
In regard to dietary intake, 79.8% of the participants in 2007 ate at least 3 full meals per day. This number decreased to 67.5% in 2014. The frequency of intake of common food types is shown in Supplementary Table 3. In regard to physical activity, only 25.0% (in 2007) and 32.5% (in 2014) of the participants were considered physically active.
The parent characteristics, including anthropometric measurements (BMI, waist circumference, hip circumference), HbA1c level, and sociodemographic and lifestyle information are outlined in Table 1 and Supplementary Table 2. In 2007, the mean annual household income was Indonesian Rupiah (IDR) 19,065,875±24,466,441, while it was IDR 30,691,791±31,959,653 in 2014. Of these incomes, the proportion that went toward food expenditure was 56.32%±14.24% in 2007 and 49.36%±15.92% in 2014.
2. Association of birth weight with the level of HbA1c in adolescence and early adulthood
Table 2 presents the results from bivariate analysis examining the associations among the characteristics of children, parents, and households with the levels of HbA1c in 2007 (when the children were aged 10–15 years) and in 2014 (when they were aged 17–22 years). Among all associations, we observed that the weight-for-age z-score at birth and the HbA1c level of the parents were significantly associated with the HbA1c level in early adolescence (2007). In addition, we observed that the weight-for-age z-score at birth, food expenditure, and nonfood expenditure were significantly associated with the level of HbA1c in early adulthood (2014). The crude β (95% CI) of the association between birth weight and HbA1c was 0.150 (-0.076, 0.377) in 2007 and 0.146 (-0.060, 0.351) in 2014.
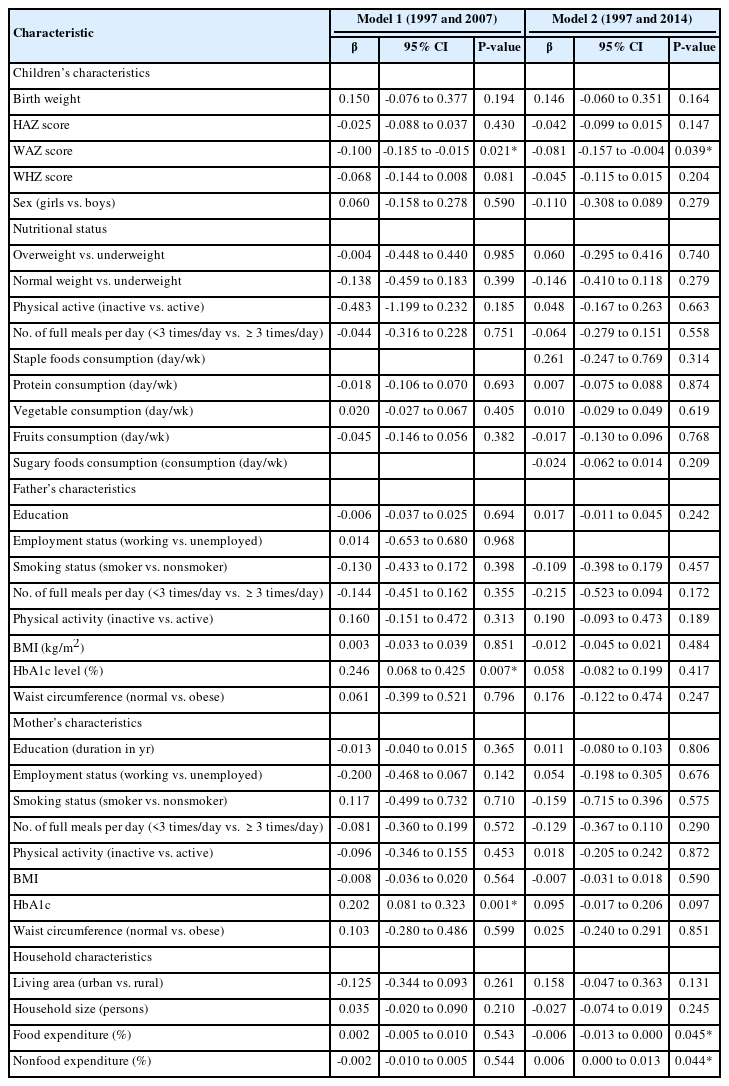
The associations of children's, parent's, and household characteristics with the levels of HbA1c in 2007 and 2014 (bivariate analysis)
Table 3 displays the results of the generalized linear model examining the associations between infant birth weight (1997) and the levels of HbA1c in adolescence (2007) and early adulthood (2014). Significant covariates from the prior bivariate analysis were included in this multivariate analysis. The associations were adjusted for the characteristics of children and parents, as well as sociodemographic factors as the confounders. All the covariates with significant associations are shown in Table 3.
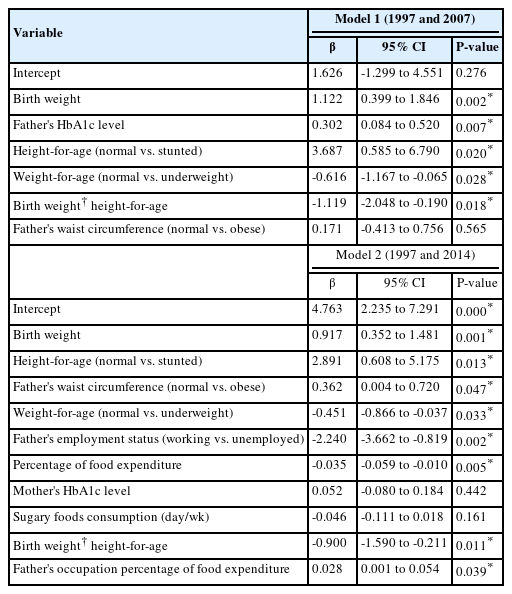
Multivariate analysis - the associations between birth weight and HbA1c levels in adolescence (10–15 years; 2007) and early adulthood (17–22 years; 2014)
We observed that a birth weight of 1 kg was associated with an adjusted β (95% CI) of HbA1c of 1.12 (0.40–1.85) in 2007, whereas it was associated with a 0.92 (0.35–1.48) % increase in HbA1c in 2014. From Table 3, we observe that the father's level of HbA1c and state of underweight were the covariates that were positively associated with the HbA1c level in adolescence (2007). Meanwhile, being underweight, father's unemployment, and mother's HbA1c level were positively associated with HbA1c in early adulthood (2014). We also observed that the percentage of food expenditure was inversely associated with HbA1c in 2014.
Discussion
In this study, we investigated the association of infant birth weight with the risk of developing DM later in adolescence and early adulthood. Using a cohort of the Indonesian population, we observed children aged 0–59 months in 1997 and followed them until they were 10–15 years old in 2007 and 17–22 years old in 2014. We used HbA1c as the biomarker of DM risk.
The level of HbA1c was higher when the individuals were adolescents rather than young adults. Birth weight was positively associated with HbA1c in both follow-up measurements in 2007 and 2014. Several factors partly explained the association between birth weight and HbA1c later in life, namely parents’ levels of HbA1c, father's employment status, percentage of food expenditure, and underweight.
Our findings of higher level of HbA1c in adolescence than in early adulthood is consistent with the findings of several prior studies [15-19]. One study observed that HbA1c tends to rise throughout puberty, as more calories are required for organ maturation. This may result in changes in adipose tissue metabolism, which leads to changes in leptin, adiponectin, and insulin levels [20]. This may lead to more rapid glucose metabolism and control over appetite. Our results also support those of a previous study showing the importance of glycemic control in this age group, and that redefinition of normal glycemia and pre-DM in adolescents may be necessary.
Moreover, our results showed that infant birth weight is positively associated with HbA1c levels in adolescence and early adulthood. Nevertheless, we also observed that underweight was positively associated with the level of HbA1c in the 2 periods. These findings aligned with those of earlier studies, which concluded that infants born with either low or very high birth weight have a greater risk of developing DM [4]. Although high birth weight is a more widely recognized risk factor for childhood obesity and earlier onset of type 2 DM, low birth weight and a history of small for gestational age are associated with higher insulin resistance (mean homeostasis model assessment of insulin resistance) and the components of metabolic syndrome [21-23].
The level of HbA1c of parents was also correlated with the HbA1c level of their offspring in adolescence and early adulthood. Although genetics is a known risk factor, and it is well established that the offspring of DM patients have higher HbA1c levels than those of nondiabetic parents [24]. This phenomenon may be attributed to the similar lifestyle (including dietary intake and physical activity) and shared socioeconomic characteristics within the same household.
In regard to sociodemographic confounding factors, we observed that the employment status of the father and the percentage of food expenditure also partly explained the association between birth weight and HbA1c levels in adolescence and early adulthood. These findings partially aligned with those of earlier studies. A previous study observed that fathers' unemployment and low socioeconomic status were closely linked with higher HbA1c and complications of type 1 DM in their children [15,25-27]. Another study showed that satisfactory employment status of the father is positively associated with better glycemic control in their diabetic offspring [28]. This may be partially explained by their dietary patterns, as families with low socioeconomic status tend to resort to less expensive, less nutritious, and higher carbohydrate diets [29]. Meanwhile, affluent households spend more on fruits, vegetables, and other healthy foods, although no difference was found in their spending on unhealthy foods (e.g., sugar-sweetened beverages) [30].
Another study observed that those whose food expenditure included eating outside the home twice a week or more, particularly fried chicken and hamburgers, were associated with an increased risk of type 2 DM [31]. In another study that focused on households with DM, it was shown that households with DM spend more on unhealthy foods, such as oil and dressing, butter, ready meals, and processed red meat [32].
The strength of this study was that it represented the majority of the Indonesian population, enabling us to generalize the findings to the national population. In addition, although several publications in recent years have used IFLS data to identify the incidence of DM in the Indonesian population, these studies were all cross-sectional analyses that only employed data from a single measurement or time point. The present study was the first to use multi-year observations or repeated measurement data from IFLS (from 1997, 2007, and 2014 time points), which may aid in constructing a causal relationship. Nevertheless, several limitations should be mentioned. First, owing to the observational nature of this study, the possibility existed of residual confounding that may have distorted the true exposure-outcome association investigated. Second, owing to the nature of the data collection performed by visiting the homes of the respondents, the HbA1c levels were measured by the DBS method. This method may result in slight overestimation of the HbA1c level. Nevertheless, a previous study showed that a strong correlation did not exist between HbA1c levels from DBS versus venous plasma. Thus, this difference would have minimal importance [33,34]. This study also included participants from rural areas in Indonesia that often had limited laboratory facilities. Thus, the DBS method was the most feasible and practical test to be conducted. Third, owing to the nature of data collection, the possibility existed of a social desirability bias; i.e., the participants may have provided socially expected answers when the lifestyle (dietary intake, physical activity) was assessed. Nevertheless, lifestyle did not appear to explain the association between birth weight and HbA1c; therefore, this aspect would not have altered our results.
Despite these limitations, as cohorts with repeated measurements in metabolic profiles of the Indonesian population remain rare, we believe that this study contributes to the literature and can become a foundation for more extensive research measuring the effect of birth weight on the risk of DM onset later in life.
In conclusion, we observed that the HbA1c level was higher in adolescence than in early adulthood in this cohort of the Indonesian population. Birth weight was associated with HbA1c levels in both periods, and parents’ HbA1c, father’s unemployment, percentage of food expenditure, and underweight partly explained the association between birth weight and HbA1c level.
Supplementary material
Supplementary Table 1 can be found via https://doi.org/10.6065/apem.2346146.073.
Nutritional status of children aged 0–59 months in 1997
Lifestyle and sociodemographic characteristics in 2007 and 2014
Dietary intake of the participants in 2007 and 2014
Notes
Conflicts of interest
No potential conflict of interest relevant to this article was reported.
Funding
This research was funded by the Directorate of Research and Development, Universitas Indonesia under Hibah PUTI 2022 (Grant No. NKB-1286/UN2.RST/HKP.05.00/2022).
Data availability
The data that support the findings of this study can be provided by the corresponding author upon reasonable request.
Author contribution
Conceptualization: RADS, EP, NA, AQM, WKYP, SPH; Data curation: RADS, EP, NA, AQM, WKYP, SPH; Formal analysis: RADS, FSS, EP, NA, AQM, SPH; Funding acquisition: RADS, EP, NA, AQM, WKYP, SPH; Methodology: RADS, EP, NA, AQM, WKYP, SPH; Project administration: RADS, EP, AQM, WKYP; Visualization: RADS, FSS, EP, NA, AQM, SPH; Writing - original draft: FSS; Writing - review & editing: RADS, FSS