Kim, Kim, Yoon, Cheon, and Yoo: The impacts of COVID-19 on childhood obesity: prevalence, contributing factors, and implications for management

Abstract

Purpose

This study aimed to identify changes in the prevalence of obesity and related diseases among children and adolescents during the coronavirus disease 2019 (COVID-19) pandemic.

Methods

This study was conducted using data from the 2016–2021 Korean National Health and Nutrition Examination Survey and included 3,861 children and adolescents aged 10–18 years. The prevalence of obesity and related diseases was adjusted for age, sex, and income. We also analyzed the socioeconomic, nutritional, and physical activity items in the survey.

Results

During the COVID-19 pandemic, there was a significant increase in the prevalence of obesity (p=0.02), central obesity (p=0.001), mean body mass index (BMI, p=0.03), and hemoglobin A1c (p=0.005) among children and adolescents aged 10–18 years. The intake of food and calories was significantly reduced in the normal-weight group (p=0.001 and <0.001) but not in the obese group. Incidences of skipping breakfast increased and eating out decreased, regardless of obesity status. However, the changes in health behaviors were not significant. The prevalence of central obesity and increased BMI showed a significant linear association between children and their parents, especially in the 10–12-year-old age group. A clear increase in the proportion of metabolically unhealthy children and adolescents was observed in the obese group, and the frequency of central obesity in parents also increased.

Conclusions

The number of metabolically unhealthy, obese children and adolescents increased during the COVID-19 pandemic. Age-specific strategies that consider growth, development, and genetic and social factors are required. Health strategies targeting the entire family are required to develop healthier habits.

Highlights

· During the coronavirus disease 2019 (COVID-19) pandemic, obesity and metabolic issues increased in Korean children and adolescents. The characteristic change revealed in this study during COVID-19 highlights the need for age-specific and family-centered health strategies to combat these rising metabolic health issues.

Introduction

Childhood obesity is a major public health problem around the world [1,2]. The prevalence of obesity in children and adolescents continues to increase worldwide, with adolescent obesity recognized as a new epidemic disease [1,3]. Due in part to the occurrence of the new infectious disease coronavirus disease 2019 (COVID-19), the number of obese children is steadily increasing [2].
It is well-known that obesity is closely related to metabolic health status [3]. Obesity causes excessive fat accumulation, leading to dyslipidemia and hypertension. Moreover, obesity increases insulin resistance, resulting in glucose intolerance and metabolic disorders [2,3]. Overweight children show a higher risk of becoming obese adults [2,4]. An increase in the unhealthy population reduces the quality of life of individuals and families and adversely affects the National Health Insurance [5]. Abuse of diet pills and eating disorders are common problems for children and adolescents [6].
Childhood is an important period of life for health intervention to prevent obesity development. It is common practice to eat less and move more to prevent obesity; however, the factors affecting obesity and metabolic syndromes remain controversial. Various analyses of the factors related to these changes have been attempted, but none have been definitive.
During the COVID-19 pandemic, changes in national policies, such as self-isolation and school/restaurant closures, changed everyday life. Therefore, this is a good opportunity to compare and observe the factors that affected the changes in the prevalence of obesity before and during the COVID-19 pandemic.
We aimed to identify the annual changes in the prevalence of obesity, diabetes, dyslipidemia, and hypertension before and during the COVID-19 pandemic. We also investigated lifestyleassociated factors, such as dietary habits, nutritional differences, and physical activity, which contributed to these changes before and during the COVID-19 pandemic. Through this study, we intend to investigate areas of focus in healthcare for children and adolescents and factors that can improve metabolic health.

Materials and methods

1. Study population and data

This study used data from the Korean National Health and Nutrition Examination Survey (KNHANES). The KNHANES is an ongoing cross-sectional national survey in Korea that has assessed the population’s health status, health behavior, nutrition, and prevalence of chronic diseases since 1998. Using Korean population census data as a sampling frame, this survey was conducted on 25 households in the sample survey area, amounting to a total of 4,800 households in 192 survey districts per year, using the 22-stage stratified cluster collection method. Our study used health examinations, nutrition surveys, and health interviews from the 7th (2016–2018) and 8th (2019–2021) KNHANES. Detailed information on KNHANES has been reported by the Center for Korea Disease Control and Prevention Agency and can be downloaded from their website. Of the total of 44,705 participants, 3,861 children and adolescents aged 10–18 years were included. Informed consent was obtained from all individuals who participated in the KNHANES. The study protocol was approved by the Institutional Review Board (IRB) of Pusan National University Yangsan Hospital (IRB No. 05-2023-081). All procedures were performed in accordance with the Declaration of Helsinki.

2. Methods and statistical analysis

The data were divided and compared before and during the COVID-19 pandemic (2016–2019 vs. 2020–2021). Participants were divided into an overweight/obese group with a body mass index (BMI) ≥85th percentile and a normal-weight group (BMI<85th percentile). We analyzed the prevalence of dysglycemia, dyslipidemia, hypertension, and obesity and their trends, which were adjusted for sex, age, and household income. The correlations between obesity of parents and children, nutritional intake, and health behavior were also analyzed to identify the factors affecting obesity and health status. All statistical analyses were performed using SAS OnDemand for Academics (SAS Institute Inc., Cary, NC, USA) using sampling weights. SURVEYLOGISTIC was used for prevalence analysis, SURVEYFREQ or SURVEYRMENAS were also used for the analysis, depending on the type of variable. SURVEYREG was used for the adjusted linear regression. The results were described as weighted counts (percentages) or weighted means with confidence intervals. Statistical significance was set at P<0.05.

3. Definitions of metabolic syndrome variables

Overweight and obesity were defined as a BMI ranging from the 85th to 95th percentile and ≥95th percentile for age and sex, respectively. Dysglycemia was defined as abnormalities in one or more of the following: fasting blood sugar (FBS) ≥126 mg/dL, 126>FBS≥100 mg/dL, hemoglobin A1c (HbA1c) ≥6.5%, or 6.5%>HbA1c≥5.7%. Dyslipidemia was defined as abnormalities in one or more of the following: hypercholesterolemia (total cholesterol ≥200 mg/dL), hypertriglyceridemia (triglycerides [TG] ≥150 mg/dL), hypo-high-densit y lipoprotein cholesterolemia (high-density lipoprotein cholesterol [HDL-C] <40 mg/dL in males aged 10–18 years and females aged 10–15 years, and <50 mg/dL in females aged 16–18 years), hyper-low-density lipoprotein cholesterolemia (low-density lipoprotein cholesterol ≥130 mg/dL), and hyper-non-highdensity lipoprotein cholesterolemia (non-HDL-C ≥145 mg/dL). Hypertension was defined as a systolic blood pressure (BP) ≥130 mmHg or a diastolic BP ≥85 mmHg. Definitions of abnormal levels of TG, HDL-C, and BP were based on the International Diabetes Federation diagnostic criteria [7]. Based on BMI (≥85th percentile or not) and the presence of more than one of the metabolic syndrome-related indicators, subjects were classified into 4 groups: metabolically healthy normal weight (MHNW), metabolically unhealthy normal weight, metabolically healthy obesity (MHO), and metabolically unhealthy obesity (MUHO). The metabolically healthy group was defined as those who met all the normal criteria for BP, HDL-C, TG, FBS, and HbA1c. Central obesity was defined as ≥90th percentile for waist circumference (WC) according to sex and age in children and adolescents.

Results

1. General characteristics

A total of 3,861 participants (weighted frequency: 4,454,060) aged 10–18 years was included in the survey period, and 53.2% were male (2,053 participants). The number of participants and proportions of genders were similar for each surveyed year, but the proportion of the elementary school aged group was higher in 2020–2021. There was no significant (P=0.108) difference in income level in the annual survey; however, starting with the COVID-19 pandemic, the proportion of the population with a high income level decreased (32.38% to 29.76%) and the that with a middle-high income level increased (31.89% to 36.46%) (Supplementary Table 1).
When comparing average values of BMI, BP, HbA1c, FBS, and lipid blood levels, significantly increasing trends of mean BMI (21.0 to 21.4 kg/m2, P=0.03) and mean HbA1c (5.36% to 5.4%, P=0.005) were observed after the COVID-19 pandemic (Supplementary Table 2).

2. Prevalence of overweight/obesity and normal weight

Table 1 shows the significant increase in the prevalence of obesity and overweight among children and adolescents aged 10–18 years (from 22.01% to 26.38%, P=0.02). The prevalence of obesity was the most prominent, increasing from 12.55% to 17.29% (P=0.002), while the prevalence of central obesity significantly increased from 11.67% to 16.39% during the COVID-19 pandemic (P=0.016).
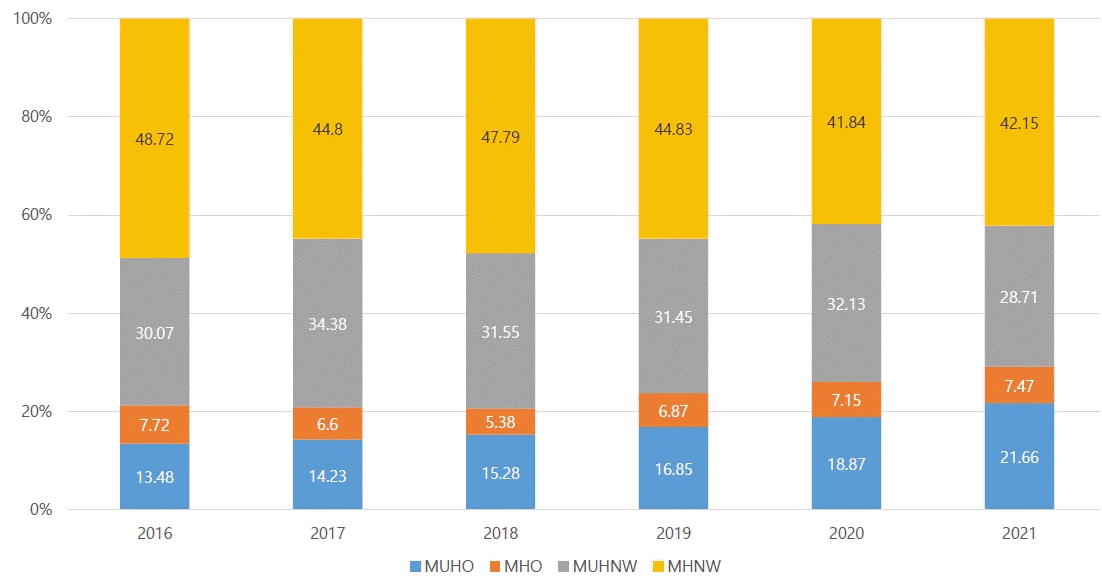
Even in the overweight/obese group, a clear increase in the number of metabolically unhealthy children and adolescents was observed. The prevalence of MUHO has not only steadily increased since 2016 (P for annual trend <0.001), but it also increased significantly in 2020–2021 (P for trend=0.002). In contrast, MHNW showed a clear declining trend, with the prevalence decreasing not only annually (P for annual trend=0.035) but also in 2020–2021 (P for trend=0.03) (Fig. 1).
The changes before and after COVID-19 by dividing each metabolic index into overweight/obese and normal weight groups are presented in Table 2. In the overweight/obese group, the proportion of 6.5%>HbA1c≥5.7% increased significantly from 14.53% to 23.16% (P=0.038). The prevalence of insulin resistance and dyslipidemia increased in the overweight/obese group; however, the difference was not significant. The increase in dyslipidemia appeared to be due to an increase in TG and a decrease in HDL-C levels. Metabolic indicators in the normalweight group showed similar prevalence before and after COVID-19.

3. Correlation between parental obesity and child obesity

During the COVID-19 pandemic, there was an increasing trend among parents experiencing central obesity, along with an increase in obesity among children and adolescents. We investigated the frequency of central obesity and obesity among children with obese parents, wherein the 10–12-year-old age group showed the most significant increase (14.2% to 23.3%, P=0.033 with mother, and 12.6% to 28.7%, P=0.002 with father). The adjusted linear regression analysis showed a significant linear association between the WC and BMI of children and their parents, and this association became stronger during the pandemic. Moreover, the regression coefficient of mothers was greater than that of fathers for both central obesity and obesity. For details and the calculation formula, see Supplementary Tables 3-6.

4. Changes in nutrition, dietary habits, and health behaviors

During the COVID-19 pandemic, a general decline in food intake among children and adolescents aged 10–18 years was observed (Supplementary Table 7). Food and energy intake decreased significantly in the normal-weight group but not in the overweight/obese group. In the normalweight group, overall nutrient intake, such as calories, protein, saturated fatty acids, sugars, thiamine, and folic acid, as well as carbohydrates, decreased. In the overweight/obese group, only the carbohydrate intake was significantly reduced (from 303.4 g to 276.9 g, P=0.014). Throughout the survey period, niacin intake was below the recommended level [8] for middle and high school students. During the COVID-19 pandemic, niacin intake in elementary school students also fell below the recommended level [8]. Similarly, folic acid and vitamin C intake for middle and high school students was below average requirements [8] throughout the survey, while elementary school students had insufficient folic acid intake during the pandemic.
A comparison of dietary habits before and during the COVID-19 pandemic revealed an increase in the proportion of people who skipped breakfast, particularly in the overweight/obese group. The frequency of having lunch with family members increased, while eating out declined across all groups regardless of obesity status (Table 3).
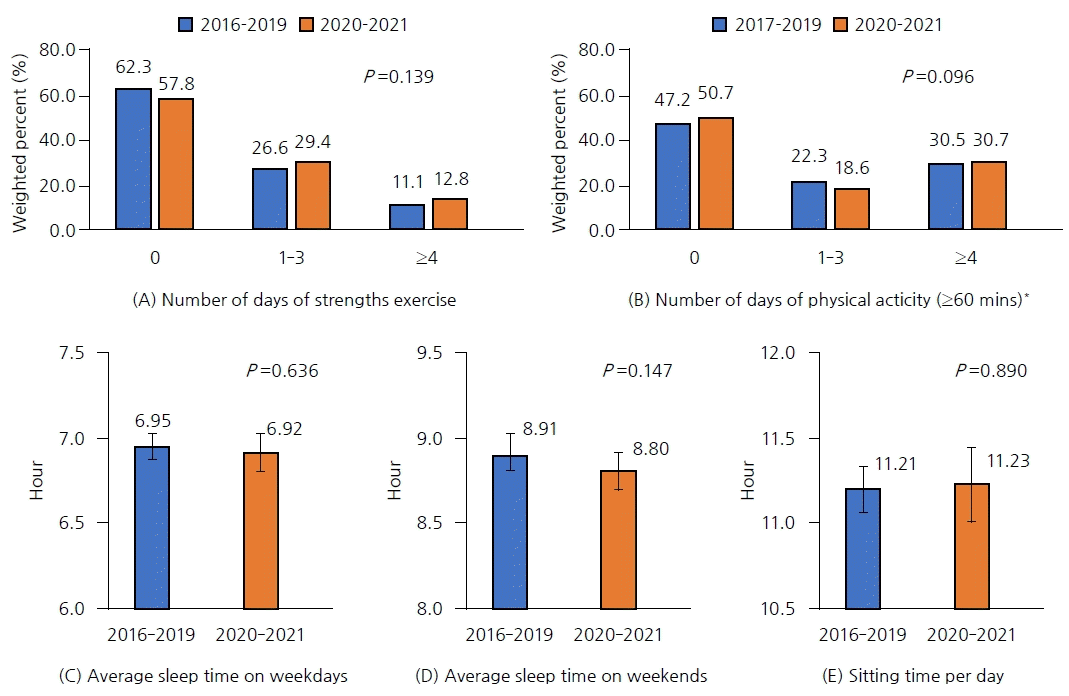
Physical activity tended to decline in both the number of strength training days per week and the number of days active for at least 60 min/day. The average sleeping time on weekdays and weekends and the duration of inactivity remained unchanged during the COVID-19 pandemic. The results are shown in Fig. 2.

Discussion

The results of this study revealed that the prevalence of childhood obesity and overweight continued to increase before and during the COVID-19 pandemic. The observed increase in the prevalence of overweight/obesity among Korean adolescents from 2018–2021 is consistent with previous epidemiological studies on trends in pediatric obesity [2,9] and reports indicating a surge in obesity among Korean children during the COVID-19 pandemic [10].
Although obesity is not always metabolically unhealthy, those classified as MHO are at risk of MUHO [9,11]. In 2020–2021, the prevalence of MUHO significantly increased, whereas the prevalence of MHNW decreased. Taken together, these findings indicate that Korean adolescents have become increasingly obese and unhealthy during the COVID-19 pandemic.
The prevalence of diabetes in children and adolescents is gradually increasing [12]. When comparing metabolic factors before and during the COVID-19 pandemic, we found that obesity influenced the increasing trend in prediabetes; however, there were no significant changes in other factors except 6.5%>HbA1c≥5.7%. Most of the data used in this study was FBS (99.8% of the total). However, since postprandial hyperglycemia serves as an early indicator of insulin resistance and overweight [13], lack of data on postprandial blood glucose level may affect the results of this study. This may explain why dysglycemia was not high in this study. In addition, considering that the definition of diabetes includes not only FBS ≥126 mg/dL and/or HbA1c ≥6.5% but also random glucose ≥200 mg/dL with symptoms and glucose level ≥200 mg/dL after a two-hour 75 g oral glucose tolerance test, the prevalence of diabetes may be underestimated.
Insulin resistance is a key factor in metabolic syndrome, and blood free fatty acids (FFA) contribute to its early development by stimulating glucose, TG, and very-low-density lipoprotein production in the liver. Our study of obese children and adolescents showed increasing TG and HbA1c levels, along with decreased HDL-C levels, which may lead to other metabolic issues. In addition, as adipose tissue increases, pro-inflammatory cytokines also rise [14], contributing to insulin resistance. During the COVID-19 pandemic, we observed a trend of increased homeostatic model assessment for insulin resistance level >2.0 in all participants, irrespective of obesity or normal weight groups. Moreover, the prevalence of TG-glucose index ≥8.45 [15] also increased, particularly in 2020.
Our study revealed a strong correlation between BMI and central obesity in parents and their children, especially in the elementary school aged group, as children are heavily influenced by their parents. During the COVID-19 pandemic, as the frequency of eating with family members increased, the influence of families on their children strengthened. Previous studies have shown that children with overweight/obese parents exhibited unhealthy dietary and lifestyle habits [16], wherein the higher was the mother's BMI, the higher was the child's BMI.
Moreover, physical activity decreased, leading to longer periods of sitting [17]. Unhealthy BMI in children has also been associated with increased screen use5 [18], and reduced fruit consumption [19]. These findings support the notion that parental BMI reflects health habits, which affect the child's health habits and weight status [20]. Therefore, family counseling is thought to be more effective to treat obese children, and a family centered healthy life, including diet and physical activity, should be emphasized, especially in younger children. However, this correlation was not significant in the middle school and high school aged groups, possibly because the influence of parents on their children's behavior decreased as the children matured and became more independent [21]. Furthermore, school programs [22] and peer [23] influence can also affect behavior and BMI status in older children. Therefore, adolescents may require a distinct approach that encompasses a wider range of aspects.
It is well-known that reduced fruit and vegetable intake leads to obesity [2,19]. Kim et al. [24] reported a decrease in fruit intake among 12–18-year-olds during the COVID-19 pandemic; however, our study did not identify any significant changes in the intake of fiber or vitamins, which are abundant in these foods. It was confirmed that the intake of niacin, folic acid, and vitamin C was lower than the recommended intake presented in the Dietary Reference Intakes for Koreans in 2020 [8] among middle and high school students. Since niacin is known to inhibit TG synthesis and reduce HDL-apoA-I catabolism, reduced niacin intake may play a role in the increasing dyslipidemia in children and adolescents. Folic acid level showed a significant positive correlation with HDL-C and a significant negative correlation with TG [25]. Thiamine is an essential trace element for glucose metabolism, and doubling the daily thiamine intake was significantly associated with a 7% reduction in metabolic syndrome among adults with comorbidities [26]. Folic acid supplementation could protect against obesity and prevent obesity-related complications, such as insulin resistance, and cardiovascular and metabolic disorders [27]. Vitamin C has an antioxidant effect that removes free radicals, which can play a role in improving vascular endothelial dysfunction caused by increased free radicals, owing to paracrine effects in the adipose tissue [28]. Therefore, reduced fruit and vegetable intake may have been responsible for the increased prevalence of obesity during the COVID-19 pandemic due to the reduced intake of vitamins. However, excessive vitamin B intake may contribute to obesity [29], and high-dose vitamin C does not improve endothelial dysfunction or insulin resistance [30], and further research is needed into the link between reduced trace element intake and obesity.
According to a previous meta-analysis, skipping breakfast increases the risk of overweight/obesity [31], and adolescents who regularly eat breakfast have lower body fat [32]. We discovered that the proportion of people who skipped breakfast increased during the COVID-19 pandemic, particularly in the obese group. There are several reasons that skipping breakfast can lead to obesity. Eating breakfast can positively impact obesity by disrupting long-term fasting, regulating glucose homoeostasis and insulin sensitivity [33] and enabling greater physical activity thermogenesis in the morning [34]. While breakfast helps maintain more stable afternoon and evening glycemia than fasting, skipping breakfast leads to increased postprandial hyperglycemia after lunch and dinner [34], which is associated with insulin resistance, leading to obesity. Postprandial hyperglycemia and insulin resistance can result in increased food intake by increasing insulin and FFA levels and hunger and decreasing satiety [35]. Previous studies have shown conflicting findings on the association between skipping breakfast and overweight [36], with some suggesting that skipping dinner, not breakfast, may be a predictor of weight gain and overweight/obesity [37]. However, based on our results, it can be inferred that the social influence of COVID-19 affected the frequency of eating breakfast and the occurrence of pediatric obesity. Therefore, additional research is necessary to clearly understand the mechanisms underlying the correlations between eating habits and physiological changes.
Changes in physical activity duration did not decrease significantly in our study, which is presumed to be due to the limited availability of detailed physical activity data for KNHANES. However, in a 2019–2020 comparative study using the Adolescent Health Behavior Survey [10], sleep time decreased and inactivity increased. Many other studies have also reported a correlation between lifestyle habits such as sedentary behavior or screen time [5,18] and obesity.
Although this study was conducted using nationwide survey data, it had some limitations. First, the cross-sectional data only allowed evaluation of changes in prevalence and associations among parents; hence, it remains unknown which group was reclassified into MUHO based on annual changes in health status in the same person, and evaluation of long-term child health status was not possible. Second, a fixed cut-off of 130/85 mmHg was applied to the criteria for high BP regardless of age, gender, and height. Third, during the COVID-19 pandemic, social restrictions led to increased food consumption through delivery or take-out. Without consideration of these details, the evaluation of eating habits and food quality before and during the pandemic may not be accurate.
Nevertheless, this study has the strengths of being a multifaceted study of obesity and metabolic syndrome-related indicators in a special COVID-19 environment. Metabolic diseases are not simply caused or controlled by a single factor but are complex phenomena that occur through various mechanisms. This study was meaningful since it investigated factors across age, sex, socioeconomic status, physical activity, lifestyle, parental health status, nutrition, and dietary habits.
In conclusion, obesity in children and adolescents is sensitive to the social environment, and MUHO increased during the COVID-19 pandemic. Attention should be paid during childhood to improve children's health indicators. Agespecific strategies that consider growth, development, and genetic and social factors are required. Furthermore, health strategies targeting the entire family are required to develop healthier habits to ensure that overweight/obesity or unhealthy behaviors are not passed on from parents to offspring. Efforts toward developing healthy habits will ultimately help improve children's health. Further longitudinal studies are needed to explore factors associated with metabolic health and long-term outcomes.

Supplementary materials

Supplementary Tables 1–7 can be found via https://doi.org/10.6065/apem.2346094.047.
Supplementary Table 1.
Demographics of the study participants in the KNHANES
apem-2346094-047-Supplementary-Table-1-3.pdf
Supplementary Table 2.
General characteristics of the study participants in the KNHANES
apem-2346094-047-Supplementary-Table-1-3.pdf
Supplementary Table 3.
Proportion of children’s central obesity among parents with central obesity*
apem-2346094-047-Supplementary-Table-1-3.pdf
Supplementary Table 4.
Adjusted linear regression of waist circumference between children and parents
apem-2346094-047-Supplementary-Table-4-6.pdf
Supplementary Table 5.
Proportion of children’s BMI ≥85th percentile among parents with obesity*
apem-2346094-047-Supplementary-Table-4-6.pdf
Supplementary Table 6.
Adjusted linear regression of body mass index between children and parents
apem-2346094-047-Supplementary-Table-4-6.pdf
Supplementary Table 7.
Changes in nutritional intake among children and adolescents
apem-2346094-047-Supplementary-Table-7.pdf

Notes

Conflicts of interest

No potential conflict of interest relevant to this article was reported.

Funding

This study received no specific grant from any funding agency in the public, commercial, or not-for-profit sectors.

Data availability

The data that support the findings of this study can be provided by the corresponding author upon reasonable request.

Author contribution

Conceptualization: MJK, JYY, CKC, SY; Data curation: MJK, SY; Formal analysis: MJK, SY; Methodology: MJK, CKC, SY; Project administration: MJK, M Kim, JYY, CKC, SY; Visualization: MJK, SY; Writing - original draft: MJK, SY; Writing - review & editing: MJK, MK, JYY, CKC, SY

Fig. 1.
Trends and proportions of obesity and normal weight with or without metabolic unhealthiness over time. The proportion of MUHO tended to increase, whereas that of MHNW tended to decrease annually between 2016 and 2021. The rate of change was largest in 2020–2021. The odds ratios (confidence interval, P for trend) of MUHO, MHO, MUHNW, and MHNW were 1.123 (1.049–1.201, P<0.001), 1.006 (0.918–1.101, P=0.905), 0.983 (0.936–1.032, P=0.480), and 0.951 (0.907-0.997, P=0.035), respectively. MUHO, metabolically unhealthy obesity; MHO, metabolically healthy obesity; MUHNW, metabolically unhealthy normal weight; MHNW, metabolically healthy normal weight.
apem-2346094-047f1.tif
Fig. 2.
Comparison of exercise and lifestyle. (A, B) The number of strength training days and days with physical activity ≥60 minutes were compared before and during the COVID-19 pandemic. (C–E) Durations of sleep and inactivity were compared before and during the COVID-19 pandemic. Values are presented as means with confidence intervals. COVID-19, coronavirus disease 2019. *Information on physical activity for more than 60 minutes was not available before 2016.
apem-2346094-047f2.tif
Table 1.
Prevalence of obesity and normal weight with or without metabolic unhealthiness in children and adolescents
Variable 2016–2019, weighted (%) 2020–2021, weighted (%) OR (95% CI) P-value
Obesity and overweight 22.01 26.38 1.28 (1.04–1.57) 0.02
Obesity 12.55 17.29 1.47 (1.15–1.87) 0.002
Overweight 9.46 9.08 0.96 (0.74–1.24) 0.74
Central obesity 11.67 16.39 1.5 (1.17–1.93) 0.001
MUHO 14.91 20.28 1.45 (1.14–1.85) 0.002
MHO 6.67 7.31 1.11 (0.8–1.53) 0.544
MUHNW 31.84 30.40 0.94 (0.78–1.14) 0.521
MHNW 46.55 42.00 0.83 (0.7–0.98) 0.03

OR, odds ratio; CI, confidence interval; MUHO, metabolically unhealthy obesity; MHO, metabolically healthy obesity; MUHNW, metabolically unhealthy normal weight; MHNW, metabolically healthy normal weight.

Table 2.
Prevalence of dysglycemia, insulin resistance, dyslipidemia, and hypertension in children and adolescents with or without obesity
Variable Overweight/obesity
Normal weight
2016–2019 2020–2021 OR (95% CI) P-value 2016–2019 2020–2021 OR (95% CI) P-value
Dysglycemia
 FBS (mg/dL)
  ≥100, <126 15.212 20.705 1.326 (0.878–2.002) 0.179 10.425 9.165 0.873 (0.642–1.186) 0.383
  ≥126 1.382 0.687 0.836 (0.188–3.717) 0.814 0.153 0.213 1.343 (0.241–7.469) 0.736
 HbA1c
  ≥5.7%, <6.5% 14.530 23.162 1.542 (1.024–2.321) 0.038 8.591 10.535 1.283 (0.908–1.812) 0.157
  ≥6.5% 1.167 0.678 1.040 (0.200–5.397) 0.962 0.122 0.208 1.704 (0.261–11.135) 0.577
Insulin resistance 0.654
 HOMA-IR >2.0 1.996 1.964 1.172 (0.214–6.416) 0.238 0.197 0.947 (0.065–10.546) 0.964
 TyG index ≥8.45 42.790 48.143 1.231 (0.869–1.745) 0.240 22.033 20.016 0.864 (0.884–1.510) 0.226
Dyslipidemia 51.957 53.472 1.146 (0.807–1.627) 0.445 26.148 24.692 0.918 (0.740–1.139) 0.434
 HyperCHOL 18.573 13.045 0.676 (0.424–1.087) 0.106 8.097 7.286 0.877 (0.621–1.239) 0.455
 HyperTG 26.742 28.658 1.107 (0.757–1.617) 0.599 10.598 9.772 0.901 (0.659–1.232) 0.514
 HypoHDL 26.68 27.55 1.268 (0.850–1.893) 0.243 11.190 10.149 0.924 (0.654–1.306) 0.653
 HyperLDL 15.530 11.497 0.779 (0.458–1.325) 0.355 5.516 6.119 1.119 (0.756–1.656) 0.574
 HyperNon-HDL 23.558 21.486 0.917 (0.610–1.381) 0.678 7.639 7.033 0.911 (0.641–1.294) 0.601
Hypertension 10.536 9.469 0.888 (0.502–1.568) 0.680 1.995 2.433 1.215 (0.536–2.755) 0.641

Prevalence rates were presented as weighted percentages of categorical variables.

OR, odds ratio; CI, confidence interval; FBS, fasting blood glucose; HbA1c, hemoglobin A1c; HOMA-IR, homeostatic model assessment for insulin resistance; TyG index, triglyceride-glucose index; CHOL, total cholesterol; TG, triglycerides; HDL, high-density lipoprotein cholesterol; LDL, low-density lipoprotein cholesterol.

Table 3.
Changes in dietary habits among children and adolescents
Dietary habit Overweight/obesity
Normal weight
2016–2019 2020–2021 P-value 2016–2019 2020–2021 P-value
Skip a meal
 Breakfast 32.2% 41.4% 0.032 31.5% 33.1% 0.569
 Lunch 9.7% 9.2% 0.860 7.2% 6.8% 0.731
 Supper 6.9% 4.4% 0.187 5.9% 6.5% 0.634
Meals with family within the recent year
 Breakfast 97.1% 98.0% 0.638 98.0% 98.3% 0.749
 Lunch 1.9% 19.5% <0.001 1.0% 2.4% <0.001
 Supper 79.6% 94.9% <0.001 78.5% 90.7% <0.001
Eating out (times/wk) <0.001 <0.001
 ≥5 94.9% 68.3% 95.2% 67.3%
 3–4 2.2% 19.4% 2.7% 18.6%
 ≤2 2.8% 12.3% 2.2% 14.2%

References

1. Di Cesare M, Sorić M, Bovet P, Miranda JJ, Bhutta Z, Stevens GA, et al. The epidemiological burden of obesity in childhood: a worldwide epidemic requiring urgent action. BMC Med 2019;17:212.
pmid pmc
2. World Health Organization. Fact sheet. Obesity and overweight [Internet]. Geneva (Switzerland): World Health Organization; 2024 [cited 2023 Feb 25]. Available from: https://www.who.int/news-room/fact-sheets/detail/obesity-and-overweight.

3. Deckelbaum RJ, Williams CL. Childhood obesity: the health issue. Obes Res 2001;9 Suppl 4:239S–243S.
crossref pmid
4. Parsons TJ, Power C, Logan S, Summerbelt C. Childhood predictors of adult obesity: a systematic review. Int J Obes Relat Metab Disord 1999;23 Suppl 8:S1–107.
pmid
5. Ebbeling CB, Pawlak DB, Ludwig DS. Childhood obesity: public-health crisis, common sense cure. Lancet 2002;360:473–82.
crossref pmid
6. Lee Y, Lee KS. Relationship between unhealthy weight control behaviors and substance use patterns among Korean adolescents: results from the 2017 national youth risk behavior survey. Public Health 2019;174:56–64.
pmid
7. Zimmet P, Alberti G, Kaufman F, Tajima N, Silink M, Arslanian S, et al. The metabolic syndrome in children and adolescents. Lancet 2007;369:2059–61.
crossref pmid
8. Ministry of Health and Welfare. Dietary reference intakes for Koreans 2020. Sejong (Korea): Ministry of Health and Welfare. 2020.

9. Kim HY, Kim JH. Temporal trends in the prevalence of metabolically healthy overweight and obesity in Korean youth: data from the Korea National Health and Nutrition Examination Survey 2011-2019. Ann Pediatr Endocrinol Metab 2022;27:134–41.
crossref pmid
10. Kang S, Seo MY, Kim SH, Park MJ. Changes in lifestyle and obesity during the COVID-19 pandemic in Korean adolescents: based on the Korea Youth Risk Behavior Survey 2019 and 2020. Ann Pediatr Endocrinol Metab 2022;27:281–8.
crossref pmid pmc
11. Videira-Silva A, Freira S, Fonseca H. Metabolically healthy overweight adolescents: definition and components. Ann Pediatr Endocrinol Metab 2020;25:256–64.
crossref pmid
12. Lawrence JM, Divers J, Isom S, Saydah S, Imperatore G, Pihoker C, et al. Trends in prevalence of type 1 and type 2 diabetes in children and adolescents in the US, 2001-2017. JAMA 2021;326:717–27.
crossref pmid pmc
13. Patarrão RS, Lautt WW, Afonso RA, Ribeiro RT, Fernandes AB, Boavida JM, et al. Postprandial but not fasting insulin resistance is an early identifier of dysmetabolism in overweight subjects. Can J Physiol Pharmacol 2012;90:923–31.
crossref pmid
14. Espinola-Klein C, Gori T, Blankenberg S, Munzel T. Inflammatory markers and cardiovascular risk in the metabolic syndrome. Front Biosci (Landmark Ed) 2011;16:1663–74.
crossref pmid
15. Moon S, Park JS, Ahn Y. The cut-off values of triglycerides and glucose index for metabolic syndrome in American and Korean adolescents. J Korean Med Sci 2017;32:427–33.
crossref pmid
16. Kosti RI, Panagiotakos DB, Tountas Y, Mihas CC, Alevizos A, Mariolis T, et al. Parental body mass index in association with the prevalence of overweight/obesity among adolescents in Greece; dietary and lifestyle habits in the context of the family environment: the Vyronas study. Appetite 2008;51:218–22.
crossref pmid
17. Sijtsma A, Sauer PJ, Corpeleijn E. Parental correlations of physical activity and body mass index in young childrenthe GECKO Drenthe cohort. Int J Behav Nutr Phys Act 2015;12:132.
crossref pmid pmc
18. Maffeis C, Talamini G, Tato L. Influence of diet, physical activity and parents’ obesity on children’s adiposity: a fouryear longitudinal study. Int J Obes Relat Metab Disord 1998;22:758–64.
crossref pmid
19. Alinia S, Hels O, Tetens I. The potential association between fruit intake and body weight – a review. Obes Rev 2009;10:639–47.
crossref pmid
20. Ventura AK, Birch LL. Does parenting affect children's eating and weight status? Int J Behav Nutr Phys Act 2008;5:15.
crossref pmid pmc
21. Silventoinen K, Rokholm B, Kaprio J, Sørensen TI. The genetic and environmental influences on childhood obesity: a systematic review of twin and adoption studies. Int J Obes (Lond) 2010;34:29–40.
crossref pmid
22. Fernandes MM, Sturm R. The role of school physical activity programs in child body mass trajectory. J Phys Act Health 2011;8:174–81.
crossref pmid pmc
23. Halliday TJ, Kwak S. Weight gain in adolescents and their peers. Econ Hum Biol 2009;7:181–90.
crossref pmid
24. Kim SY, Yoo DM, Min C, Choi HG. Changes in dietary habits and exercise pattern of Korean adolescents from prior to during the COVID-19 pandemic. Nutrients 2021;13:3314.
crossref pmid pmc
25. Daviddi G, Ricci MA, De Vuono S, Gentili A, Boni M, Lupattelli G. Folate and vitamin B12 in morbid obesity: the influence of folate on anti-atherogenic lipid profile. Int J Vitam Nutr Res 2020;90:295–301.
crossref pmid
26. Nguyen HD, Oh H, Kim MS. An increased intake of thiamine diminishes the risk of metabolic syndrome in the Korean population with various comorbidities. Diabetes Metab Syndr 2022;16:102443.
crossref pmid
27. Dehkordi E, Sedehi M, Shahraki Z, Najafi R. Effect of folic acid on homocysteine and insulin resistance of overweight and obese children and adolescents. Adv Biomed Res 2016;5:88.
crossref pmid pmc
28. Engler MM, Engler MB, Malloy MJ, Chiu EY, Schloetter MC, Paul SM, et al. Antioxidant vitamins C and E improve endothelial function in children with hyperlipidemia: Endothelial Assessment of Risk from Lipids in Youth (EARLY) Trial. Circulation 2003;108:1059–63.
crossref pmid
29. Zhou SS, Zhou Y. Excess vitamin intake: an unrecognized risk factor for obesity. World J Diabetes 2014;5:1–13.
crossref pmid pmc
30. Chen H, Karne RJ, Hall G, Campia U, Panza JA, Cannon RO 3rd, et al. High-dose oral vitamin C partially replenishes vitamin C levels in patients with type 2 diabetes and low vitamin C levels but does not improve endothelial dysfunction or insulin resistance. Am J Physiol Heart Circ Physiol 2006;290:H137–45.
crossref pmid
31. Ma X, Chen Q, Pu Y, Guo M, Jiang Z, Huang W, et al. Skipping breakfast is associated with overweight and obesity: a systematic review and meta-analysis. Obes Res Clin Pract 2020;14:1–8.
crossref pmid
32. Cayres SU, Urban JB, Fernandes RA. Physical activity and skipping breakfast have independent effects on body fatness among adolescents. J Pediatr Gastroenterol Nutr 2018;67:666–70.
crossref pmid
33. Önnerfält J, Erlanson-Albertsson C, Montelius C, Thorngren-Jerneck K. Obese children aged 4–6 displayed decreased fasting and postprandial ghrelin levels in response to a test meal. Acta Paediatr 2018;107:523–8.
crossref pmid
34. Betts JA, Richardson JD, Chowdhury EA, Holman GD, Tsintzas K, Thompson D. The causal role of breakfast in energy balance and health: a randomized controlled trial in lean adults. Am J Clin Nutr 2014;100:539–47.
crossref pmid pmc
35. Sears B, Perry M. The role of fatty acids in insulin resistance. Lipids Health Dis 2015;14:121.
crossref pmid pmc
36. Lee JS, Mishra G, Hayashi K, Watanabe E, Mori K, Kawakubo K. Combined eating behaviors and overweight: Eating quickly, late evening meals, and skipping breakfast. Eat Behav 2016;21:84–8.
crossref pmid
37. Yamamoto R, Tomi R, Shinzawa M, Yoshimura R, Ozaki S, Nakanishi K, et al. Associations of skipping breakfast, lunch, and dinner with weight gain and overweight/obesity in university students: a retrospective cohort study. Nutrients 2021;13:271.
crossref pmid pmc