Highlights
· Patients with juvenile-onset systemic lupus erythematosus are at a high risk of entering adulthood with disease-related morbidities like reduced bone mass and osteoporosis.
· Longer duration of glucocorticoid (GC) exposure, higher cumulative GC dose, and higher cumulative hydroxychloroquine dose were associated with low bone mineral density (BMD) in patients with juvenile-onset systemic lupus erythematosus (JSLE), with the main risk factor being the duration of GC exposure.
· Patients with JSLE should be routinely monitored for low BMD and potential fracture risks, and GC-sparing treatment regimens should be considered.
Introduction
Systemic lupus erythematosus (SLE) is a multisystem autoimmune disorder characterized by chronic inflammation and damage to various organs, including the skin, joints, blood cells, brain, and kidneys [1]. Juvenile-onset SLE (JSLE) represents 15%–20% of all SLE cases, and the course of JSLE is often more severe than that of adult SLE, with a greater frequency of aggressive renal disease and a higher requirement for steroids and immunosuppressive drugs [2]. In recent studies, the overall prognosis for SLE has improved to a 10-year survival rate of >90% [3]. However, their longer survival means that patients with SLE now experience more complications and that patients with JSLE are at a greater risk of entering adulthood with disease-related morbidities like reduced bone mass and osteoporosis [4]. Furthermore, patients with JSLE are at considerable risk for developing low bone mass since they are affected by the disease before achieving peak bone mass, which serves as a future bone bank.
Several factors may adversely affect bone health in patients with JSLE, including systemic inflammation, hormonal factors, decreased physical activity, limited sunlight exposure, and inadequate calcium and vitamin D intake [5,6]. Treatments, primarily glucocorticoids (GCs) and possibly some diseasemodifying antirheumatic drugs (DMARDs), may also have a negative impact on bone health [7]. GCs are well known to reduce bone formation and increase bone resorption. However, they may also have favorable effects on bone mass through the reduction of systemic inflammation [8]. Several cross-sectional studies have assessed the effects of GC use on bone mass in adult patients with SLE, and, although some controversies remain, GCs were reported to be a risk factor for low bone mass and fractures.9-1
However, few studies to date have investigated bone health in patients with JSLE. A few cross-sectional studies on bone health in children with rheumatic disorders have reported low bone mass and an increased prevalence of fractures in this population [14-17]. Trapani et al. [14] documented a significant inverse correlation between bone mineral density (BMD) and cumulative GC dose in patients with JSLE, while Valta et al. found no correlation between BMD and cumulative GC dose in patients with juvenile idiopathic arthritis [17]. A prospective study from the Canadian Steroid-associated Osteoporosis in the Pediatric Population consortium reported that every 0.5-mg/kg increase in the average daily GC dose was associated with a 2-fold increased risk of fracture among children with rheumatic disorders, including juvenile dermatomyositis, juvenile idiopathic arthritis, systemic vasculitis, and JSLE [18].
This study aimed to evaluate the clinical characteristics of patients with JSLE and to analyze the factors associated with low BMD in these patients.
Materials and methods
1. Subjects
Children and adolescents diagnosed with JSLE from January 1, 2009, to April 30, 2022, at a single institution in Korea were included. The diagnosis was made by pediatric rheumatologists using the American College of Rheumatology and Systemic Lupus International Collaborating Clinics' classification criteria [19-21]. In this study, patients with JSLE were defined according to the definition of Silva et al. [22], which consists of SLE onset before 18 years of age, a threshold based on different gender distribution, clinical course and disease activity from adult SLE. Only patients who had undergone dual energy x-ray absorptiometry (DXA) and thoracolumbar spine radiography were considered eligible for enrollment. Patients who had received GC treatment for <3 months were excluded. This study was approved by the Institutional Review Board (IRB) of Seoul St. Mary's Hospital (IRB No. KC22RISI0496). The need for written informed consent was waived due to the retrospective nature of the study.
2. Clinical and laboratory data of JSLE
Demographic, clinical, and laboratory data, including age, height, weight, body mass index, pubertal stage, course of disease, bone-metabolism markers, serologic markers of SLE activity, and use of GCs and DMARDs, were collected. All data were collected from each patient at 2 time points: diagnosis and follow-up (the time when the latest DXA was performed).
The clinical manifestations and disease course were evaluated. Organ involvement was assessed in 5 categories: skin, joint, hematologic, and renal involvement and neuropsychiatric SLE. Skin involvement was categorized based on the presence of malar rash or photosensitivity. Joint involvement was defined as the presence of swelling or effusion in 2 or more joints. Hematologic involvement was defined by the presence of one of the following: hemolytic anemia (hemoglobin<10.0 g/dL with evidence of hemolysis), leukopenia (white blood cell count<4.0 × 10⁹/L), and thrombocytopenia (platelet count<100 x 109/L). Renal involvement was defined as histological renal damage or the presence of proteinuria (>0.5 g within 24 hours). Neuropsychiatric SLE was designated according to the American College of Rheumatology nomenclature [23]. Disease activity was assessed using the revised version of the SLE Disease Activity Index (SLEDAI) [24]. A SLE flare was defined as new or worsening clinical symptoms with escalation of treatment (i.e., new immunosuppressant use, a prednisone increase of 0.5 mg/kg/day, intravenous methylprednisolone, or hospitalization). Serological markers related to SLE disease activity were collected. Low C3 and C4 complement levels and high titers of anti-dsDNA antibodies were considered reflective of greater SLE activity [25].
The cumulative GC dose (expressed as the prednisoloneequivalent dose) was calculated according to each patient’s mean body weight (from diagnosis to follow-up) and presented in grams per kilogram. The average daily dose is presented as grams per kilogram per day. The duration of exposure was assessed, excluding periods when GC was discontinued due to improvement or remission of the disease. The use of hydroxychloroquine (HCQ) and other DMARDs (azathioprine, methotrexate, mycophenolate mofetil, and cyclosporine) was recorded from diagnosis to follow-up.
3. Bone assessment
The lumbar spine (LS) BMD (L1–4) was measured in all patients using DXA (Horizon W DXA system, Hologic Inc., Marlborough, MA, USA). All DXA data recorded from diagnosis to most recent follow-up were collected. The BMD z-score was calculated and compared with those of 1,650 healthy age- and sex-matched Korean controls [26]. Lateral thoracolumbar spine radiographs were collected from diagnosis to follow-up, when the latest DXA was performed. Spine radiographs were scored independently by 2 pediatric radiologists according to the modified Genant semiquantitative method [27]. Vertebral bodies were graded according to the extent of reduction in height ratios: 20%–25% (mild), 25%–40% (moderate), and >40% (severe). Bone-metabolism markers of interest included calcium, phosphorous, alkaline phosphatase, 25-hydroxyvitamin D, and parathyroid hormone, which were assessed at both diagnosis and follow-up.
4. Statistical analysis
Results are reported as median (interquartile range [IQR]) values for continuous variables and as proportions for categorical variables. Anthropometric data, clinical features, disease-related serological markers, bone-metabolism markers, cumulative dose and duration of GCs, and cumulative HCQ dose were compared with respect to a LS BMD of -2.0 using the nonparametric Mann-Whitney U-test. The proportion of DMARD use was compared with respect to a -2.0 LS BMD using the chi-square test. Linear regression analysis and univariate binominal logistic regression were performed to identify risk factors for low BMD. Variables identified as significant in the univariate analysis were entered into a multiple logistic regression model. Statistical calculations were performed using IBM SPSS Statistics ver. 27.0 (IBM Co., Armonk, NY, USA). Two-tailed P values of <0.05 were considered statistically significant.
Results
1. Demographic and clinical characteristics
A total of 29 patients with JSLE (25 women and 4 men) were included in this study. SLE was diagnosed at a median age of 12.7 (interquartile range [IQR], 11.5–14.8) years, and the median age at follow-up was 15.8 (IQR, 13.6–17.5) years. All patients were treated with GCs at a median daily dose of 9.9 mg, with a median cumulative dose of 14.6 g, during their median follow-up period of 4.5 (IQR, 2.2–6.9) years. The median (IQR, 25%–75%) LS BMD z-score at follow-up was -0.9 (-1.8 to 0.1) points. The prevalence of vertebral fractures (VFs) at followup was 52%, with mild, moderate, and severe fractures totaling 24%, 21%, and 10% of these, respectively. Since the presence of at least one vertebral compression fracture in the absence of local disease or high-energy trauma meets the definition for osteoporosis in children and adolescents, the prevalence of osteoporosis in the present study was 52%. The demographic data, clinical characteristics, and laboratory characteristics of the subjects at both diagnosis and the time of the latest DXA are summarized in Table 1.
2. Comparison of clinical parameters with respect to a LS BMD z -score of -2.0
Based on the latest DXA, patients with a LS BMD z-score of ≤-2.0 were classified as the low BMD group, while others were classified as the non-low BMD group. Of the 29 patients, 7 had a LS BMD z-score of ≤-2.0 points and were designated as the low BMD group. The differences in the clinical parameters between the low BMD and non-low BMD groups are summarized in Table 2 and Supplementary Table 1.
The comparison of anthropometric data at diagnosis and follow-up revealed that the low BMD group had a lower height z-score at both diagnosis (-0.043 vs. -1.651, P=0.014) and follow-up (-0.504 vs. -1.843, P=0.013) compared to the nonlow BMD group. There were no significant differences in weight and body mass index. There were no differences in clinical profiles (skin, joint, hematologic, and renal involvement and neuropsychiatric SLE), SLEDAI scores, or the number of flareup episodes between the 2 groups. The serological markers reflecting SLE disease activity and bone-metabolism markers also demonstrated no difference between the 2 groups at both diagnosis and follow-up. The low BMD group had a higher prevalence of a ≤-1.0 initial LS BMD z-score (27% vs. 100%, P<0.001) compared to the non-BMD group. The prevalences of moderate VFs (9% vs. 43%, P<0.001) and severe VFs (0% vs. 43%, P<0.001) were also higher in the low BMD group than in the non-low BMD group.
3. Comparison of medication use with respect to a LS BMD z -score of -2.0
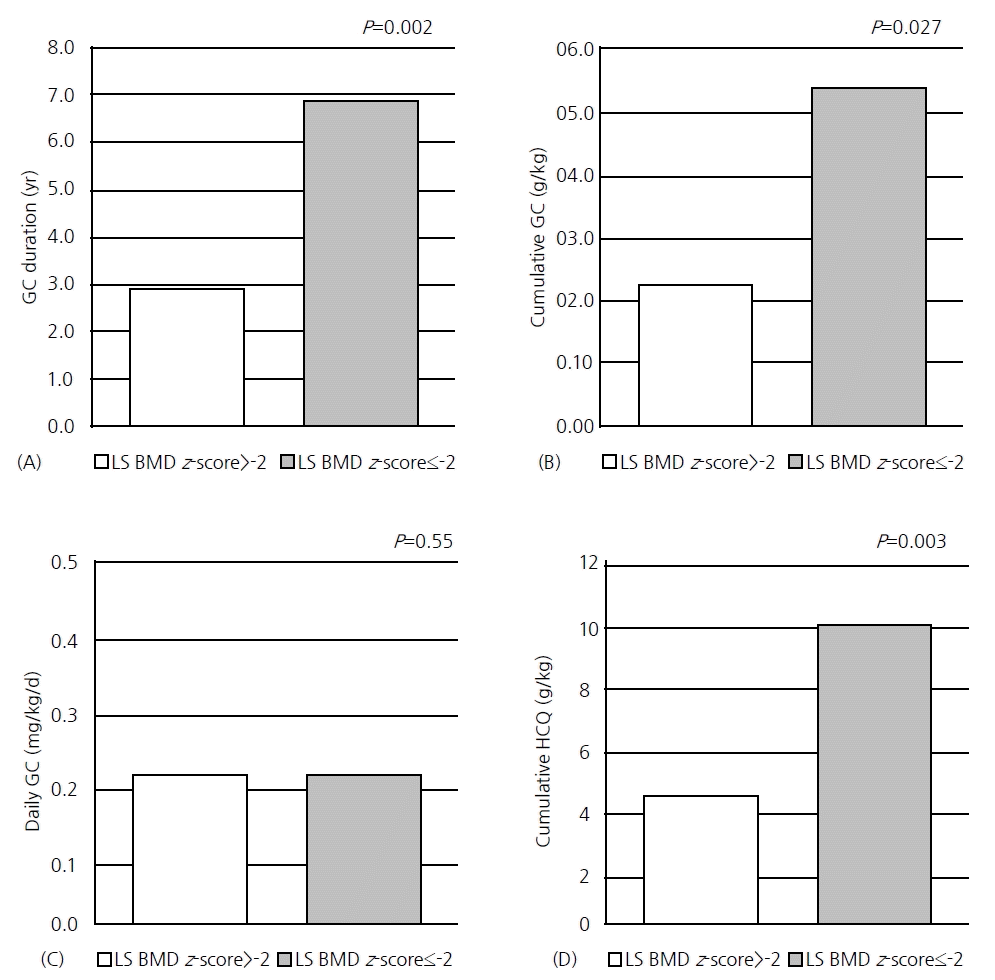
Medication use was compared with respect to a LS BMD z-score of -2.0 (Supplementary Table 2). All patients with JSLE used GCs and HCQ from the onset of their disease. The duration of GC exposure was significantly longer in the low BMD group (2.9 years vs. 6.9 years, P=0.002) than in the nonlow BMD group. The total cumulative dose (12.3 g vs. 26.8 g, P=0.021) and cumulative dose per mean body weight (0.23 g/kg vs. 0.54 g/kg, P=0.027) were also significantly higher in the low BMD group than in the non-low BMD group. However, there was no difference in the daily GC dose between the 2 groups (Fig. 1).
Tapering or discontinuation of medication was attempted with GCs but not with HCQ throughout the disease course of the present cohort. Four out of the 29 patients discontinued using GCs, although one of them restarted GC treatment due to increased disease activity. In contrast, all patients continued on HCQ from diagnosis to follow-up, and discontinuation or tapering of this medication was not attempted in any patient. This is consistent with the 2019 EULAR (European Alliance of Associations for Rheumatology) recommendations prescribing HCQ for all patients with SLE, unless contraindicated. In contrast, GC discontinuation is recommended whenever possible [28]. As the duration of HCQ was not a modifiable factor, we compared the cumulative HCQ doses between the two groups, which were 4.64 g/kg in the non-low BMD group and 10.10 g/kg in the low BMD group, respectively (P=0.003) (Fig. 1).
Other DMARDs used by cohort patients included azathioprine (55%), methotrexate (34%), mycophenolate mofetil (31%), and cyclosporine (10%). There was no significant difference in the use of DMARDs other than HCQ between the 2 groups. Regarding antiosteoporosis treatment, bisphosphonate use was significantly more common in the low BMD group (0% vs. 57%, P<0.001) than in the non-low BMD group.
4. Association between GC, HCQ, and low BMD
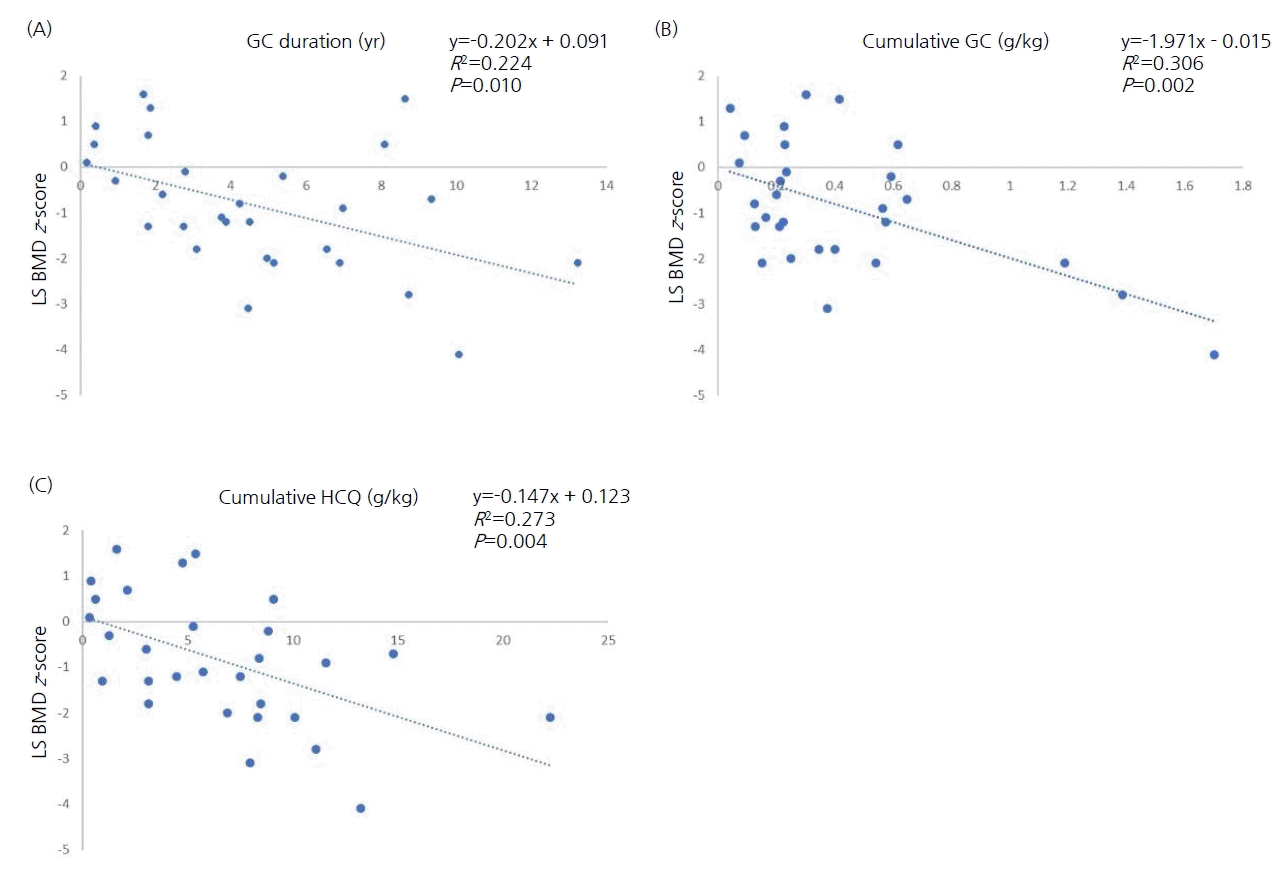
Considering that both the cumulative dose and duration of GC therapy and the cumulative HCQ dose were greater in the low BMD group, we further analyzed the association between GCs, HCQ, and LS BMD. Linear regression analyses demonstrated that the cumulative GC dose, duration of GC exposure, and cumulative HCQ dose had a statistically significant inverse relationship with the LS BMD z-score (Fig. 2).
The 3 treatment variables (cumulative dose and duration of GCs and cumulative HCQ dose) were entered into univariate logistic regression analyses for low BMD (LS BMD z-score ≤-2.0). The duration of GC exposure was significantly associated with low BMD (odds ratio [OR], 3.17; P=0.020). The cumulative GC dose (OR, 1.005; P=0.043) and HCQ dose (OR, 1.000; P=0.017) were also statistically significant, but with low relevance to a LS BMD z-score of ≤-2.0 compared to the duration of GC exposure. We performed a multivariate logistic regression analysis, including the 3 aforementioned variables; however, Pearson correlation test revealed that the 3 variables were highly correlated, rendering the model unstable. Both the duration of GC therapy and the cumulative HCQ dose were particularly interrelated, with a Pearson correlation coefficient of 0.92 (P<0.001). Therefore, we performed 3 separate analyses incorporating 2 of these 3 variables at a time for low BMD (Table 3). The best model for low BMD was the model including the duration of GC therapy and the cumulative GC dose, and the results of this analysis demonstrated that the duration of GC therapy best predicted low LS BMD (OR, 4.486; 95% confidence interval [CI], 1.035–19.445; P=0.045).
5. Association between other clinical variables and low BMD
Since the low BMD group had lower height z-score than the non-low BMD group, we further analyzed whether height deficit is a risk factor for low BMD. We adjusted the LS BMD z-score for body size [26] in 2 children with short stature (height z-score<-2.0) and performed a univariate logistic regression for low BMD. We found that height at diagnosis (P=0.093) and follow-up (P=0.108) were not risk factors for low BMD. As mentioned above, the low BMD group had a greater prevalence of a -1.0 or lower initial LS BMD z-score. Another logistic regression analysis was performed; ultimately, however, an initial LS BMD z-score ≤-1.0 was not a relevant risk factor for low BMD (P=0.994).
Discussion
The present study focused on low BMD in patients with JSLE and showed that longer duration of GC exposure, higher cumulative GC dose, and higher cumulative HCQ dose are associated with low BMD in patients with JSLE, with the main risk factor for low BMD being the duration of GC exposure. We found no significant correlation between LS BMD and clinical profile, SLE disease activity, or bone-metabolism markers. There was also no significant difference in the use of DMARDs, other than HCQ, between the low and non-low BMD groups.
Although a recent meta-analysis failed to show a correlation between GC use and low BMD in adult patients with SLE [9], several studies to date have demonstrated an association between GC use and low BMD [10-13)]. However, the results are inconsistent regarding whether the cumulative dose, treatment duration, or both, are risk factors for low BMD. Davidson et al. [11] reported that the cumulative steroid dose is significantly associated with osteoporosis (OR, 1.60; 95% CI, 1.07–2.41), whereas the duration of GC exposure is not. A recent metaanalysis of secondary osteoporosis in adult patients with SLE revealed that both the cumulative GC dose and the duration of GC therapy were significantly different between patients with and without osteoporosis [13]. Studies concerning the pediatric SLE population are scarce and have mostly focused on daily or cumulative doses of GCs rather than the duration of GC exposure. Nakhla et al. [15] reported that significant risk factors for VFs in patients with JSLE include cumulative GC dose, but the duration of GC exposure was not analyzed. A reduction in LS BMD was significantly associated with higher cumulative GC doses in the study by Lilleby et al. [4], but the authors assessed the duration of GC exposure as "current GC use or not" and did not include a specific duration. Furthermore, an increase in the average daily GC dose was shown to be associated with an increase in VF risk (hazard ratio, 1.95; 95% CI, 1.08–3.51), whereas GC intensity and the duration of GC therapy were not [29]. Our study investigated both the effect of cumulative GC dose and the effect of the duration of GC exposure on BMD and revealed that the duration of GC exposure is a notable risk factor for low BMD in patients with JSLE. This result is clinically meaningful because it may support the applicability of more aggressive use of intravenous methylprednisolone pulses upon diagnosis, which might allow for faster tapering and discontinuation of oral GCs, shortening the duration of GC exposure. Another approach may include the early initiation of immunosuppressants to facilitate tapering and discontinuation of GCs. These 2 approaches may minimize the duration of GC exposure, which may be beneficial to bone health in patients with JSLE.
HCQ is an antimalarial agent given to all patients with SLE. HCQ treats skin disease, minimizes flare-ups, and decreases auto-antibody production by inhibiting Toll-like receptor pathways [30]. In the present study, all patients used HCQ, and the cumulative HCQ dose was greater in the low BMD group, although this was not a significant risk factor for low BMD in multivariate analyses. Data regarding the effects of HCQ on bone health are scarce, and the results are conflicting. Two crosssectional studies documented higher spinal BMD associated with HCQ use, suggesting a protective effect of HCQ on bone [31,32]. In contrast, a 6-year Dutch study reported that hip BMD loss was associated with HCQ use [10]. Meanwhile, a more recent study involving 1807 adult patients with SLE found no correlation between HCQ use and BMD [33]. The impact of immunosuppressant drugs on bone health is also controversial, and it is difficult to clearly discern their effect on bone because their use usually implies a more severe SLE disease status. Methotrexate and azathioprine are considered in patients when trials with GC and HCQ or HCQ alone are insufficient to control symptoms. However, although there have been reports of patients developing multiple insufficiency fractures while on prolonged methotrexate therapy, commonly known as methotrexate osteopathy, the effects of methotrexate on bone loss are not fully understood [34,35]. An observational study of 60 patients with rheumatic arthritis did not reveal a significant difference in BMD between methotrexate users and nonusers [36]. There are minimal data on azathioprine and BMD, but a study concerning patients with Crohn disease demonstrated that azathioprine did not affect the BMD itself; however, it seemed to have a protective effect on bone mass via steroid sparing [37]. Furthermore, a recent large cross-sectional study by Cramarossa et al. [33] showed no association between immunosuppressant use and BMD. The association between DMARD use and bone loss requires further investigation.
A recent meta-analysis of secondary osteoporosis in SLE showed that, among 9 studies that reported SLEDAI scores, there was no significant difference in SLEDAI scores between patients with or without osteoporosis and SLE [13]. This result was consistent with that of our study, which showed no correlation between SLEDAI score and low BMD. In a large 5-year study of adult female patients with SLE, Zhu et al. [38] reported that SLE flares during follow-up were significantly associated with a greater reduction in LS BMD. We also investigated the relationship between flare-ups and BMD. In our study, 71% of the low BMD group and 32% of the non-low BMD group experienced flare-ups, but this difference was not statistically significant. In short, in our study, there was no significant correlation between disease activity and low BMD. In addition to SLEDAI scores and flare-ups, there was also no significant correlation between the clinical profile, serological markers of SLE activity, bone-metabolism markers, and low BMD. Although this is a negative finding, it may imply that clinical manifestations, SLEDAI score, and serological markers cannot predict low bone mass in patients with JSLE, and routine surveillance of BMD and VFs is necessary to detect early reductions in bone mass.
In the present study, the low BMD group had a lower z-score at both diagnosis and follow-up. Several studies have reported that BMD increases with height and weight [39,40]. In other words, lower height and weight values are associated with lower BMD. Although height deficit was not proven to be a risk factor for low BMD in our study, the fact that the low BMD group had lower z-scores at diagnosis and follow-up may imply that patients with JSLE with short stature should be more cautiously monitored for a decline in BMD and growth.
This study has some limitations owing to its retrospective design. First, the total number of patients with JSLE who had undergone DXA imaging and thoracolumbar spine radiography was small. Some patients did not have sufficient DXA data or spine radiographs at diagnosis, which limited further comparison of DXA data during early stages of treatment and/or at follow-up. Further prospective studies are needed to determine the effects of GCs and DMARDs on low BMD. Second, the dietary calcium and vitamin D intake and the amounts of physical activity and sunlight exposure could not be accurately assessed by chart review. Lastly, BMD analysis by DXA did not consider three-dimensional bone microarchitecture and volumetric BMD. We did not have access to quantitative measures assessed by computed tomography. However, the strength of this study is that we performed a comprehensive analysis of the effects of anthropometric, clinical, laboratory, and treatment-related variables on BMD in patients with JSLE.
In conclusion, a longer duration of GC exposure and higher cumulative GC and HCQ doses are risk factors for low BMD in patients with JSLE, with the main risk factor among them being the duration of GC exposure. Disease-activity markers of SLE and bone-metabolism markers do not predict low BMD. Thus, patients with JSLE should be routinely monitored for low BMD and potential fracture risks, and GC-sparing treatment regimens should be considered for patients with JSLE to shorten GC exposure.