The effect of metformin on vitamin B12 level in pediatric patients
Article information

Abstract
Purpose
Metformin is a common medication for patients with hyperglycemia. In adults, one well-documented side effect of metformin is vitamin B12 deficiency. However, this side effect has rarely been studied in pediatric patients. This study examined the changes of vitamin B12 level in pediatric patients being treated with metformin.
Methods
Data were collected from pediatric patients (n=151) with at least 3 months of consecutive metformin intake. The effects of dose of metformin on the mean vitamin B12 level were investigated at 6, 12, 24, and 36 months. The effect of compliance of metformin intake on vitamin B12 level also was studied.
Results
There was no significant decrease in mean vitamin B12 level at 6, 12, 24, or 36 months in patients treated with metformin. Mean vitamin B12 decrease was only noticeable (P<0.05) in patients taking a high dose of metformin with good compliance. Despite this change, the mean vitamin B12 remained well within the normal reference range. Furthermore, of the 151 patients studied, only 1 demonstrated vitamin B12 deficiency after 12 months of treatment. However, his B12 level was normal at 24 and 36 months without any vitamin B12 supplements.
Conclusions
Our findings suggest that metformin treatment in children does not cause vitamin B12 deficiency; however, the effect of long-term consistent high-dose treatment on vitamin B12 level remains unknown.
Highlights
· This is so far the first study looking at the effect on metformin on vitamin B12 level in children. This study examined the difference on metformin treatment on vitamin B12 level in relation to dosage and duration.
Introduction
In the United States, the prevalence of type 2 diabetes mellitus (T2DM) has increased threefold in adults as well as in children, with approximately 12 of every 100,000 children impacted [1,2]. A common treatment plan for T2DM patients involves metformin oral therapy in conjunction with life-style changes for weight control [3,4]. Metformin’s antihyperglycemic action is thought to suppress hepatic gluconeogenesis [5]. Metformin is currently one of the most common pharmacological agents approved for pediatric T2DM [6,7]. The use of metformin is well known to extend to other metabolic problems associated with obesity, such as mild dysglycemia and polycystic ovarian syndrome [4,8,9].
Known side effects of metformin include but are not limited to gastrointestinal distress, soft stools, diarrhea, and lactic acidosis [10,11]. A more controversial side effect is vitamin B12 deficiency. In adults, studies have shown that metformin can lower vitamin B12 level and potentially cause vitamin B12 deficiency in a dose- and duration-dependent manner [10-20]. There has rarely been any direct study of this potential problem in pediatric patients. As more and more children are treated with metformin [1], there is valid concern about vitamin B12 deficiency. Furthermore, previous work has indicated a potential decrease in vitamin B12 level in certain patients such as obese children even without metformin treatment [21].
Vitamin B12 deficiency is of great concern as it is the most common cause of megaloblastic anemia. Other problems associated with vitamin B12 deficiency include neurological abnormalities and sensory-motor deficiency [15,22]. As children undergo rapid development, failure to recognize or treat vitamin B12 deficiency could delay development in fine motor and gross motor skills and in cognition [15]. Thus, establishing and understanding the relationship between metformin treatment and vitamin B12 deficiency in pediatric patients is important. The aim of this study is to explore the possible effects of metformin dose and duration on vitamin B12 level in pediatric patients.
Materials and methods
This was a retrospective study utilizing data of pediatric patients from Nemours Children's Hospital in Orlando, Florida, USA, from January 2000 to July 2015, extracted from the electronic patient record system (EPIC). Clinical variables were metformin dosage, compliance, and vitamin B12 levels.
1. Patient inclusion
A total of 151 pediatric patients aged 6–17 years who had been prescribed metformin for at least 3 consecutive months and underwent more than 1 vitamin B12 level measurement during treatment was included. Both genders were included (32 males, 119 females). The ethnicities recorded in the system were 55 White, 30 Black, 34 Hispanic, 4 Asian, 9 others, and 19 unidentified.
2. Exclusion
Most patients selected had vitamin B12 level measured at Quest Diagnostics. Children who were hypercobalaminemic (defined as >950 pg/mL) or hypocobalaminemic (defined as <200 pg/mL) prior to treatment or who were taking vitamin B12 or multivitamin supplements were excluded.
3. Vitamin B12 level
Vitamin B12 level was measured mostly at Quest Diagnostics Lab using an immunoassay. Based on the Quest Diagnostics reference ranges for 5–9-year-old children (250–1,205 pg/mL) and 10–17-year-old adolescents (200–935 pg/mL), vitamin B12 deficiency was defined as a serum level <200 pg/mL. Vitamin B12 level was recorded at start of metformin treatment (month 0, baseline) and at approximately 6, 12, 24, and 36 months of treatment.
4. Dosage assessment
For patients included in this study, dosages of metformin ranged from 500 to 2,000 mg/day. For easier analysis, we assigned "high dose" as >1,000 mg/day (n=26, 17%) and "low dose" as ≤1,000 mg/day (n=125, 83%). For cases with dosage changes during treatment, the most frequently used metformin dosage (prior to a vitamin B12 blood test) was recorded.
5. Compliance assessment
Compliance assessment was based on chart documentation and review of the prescription refills of metformin. No evidence of missing doses and filling most refills on time were defined as "good compliance." Intermittent intake of metformin, with occasionally missed doses and refills, was defined as "fair compliance." Frequently missed dose and failure to obtain refills were defined as "poor compliance."
6. Statistical analysis
In the first set of analyses, planned t-test comparisons were performed between baseline vitamin B12 level (month 0) and that at 6, 12, 24, and 36 months. As a second step, compliance and dosage were used separately to stratify the sample and repeat these analyses. As a final step, the combination of dosage and compliance was used to divide the patients into 3 groups: high dose and good compliance, low dose and good compliance, and low dose and poor compliance. Due to small sample size (n=2), the high dose and poor compliance group was not assessed. Vitamin B12 level is reported as mean±standard deviation, and dosage is reported as frequency and percentage. Statistical analyses were performed with IBM SPSS Statistics ver. 23.0 (IBM Co., Armonk, NY, USA). T-tests were 2-tailed, and a P≤0.05 was considered statistically significant.
Results
1. Vitamin B12 changes with metformin treatment
A total of 151 patients between 6 and 17 years of age was included in analyses. The changes of mean vitamin B12 level after metformin treatment are shown in Tables 1 and 2. Compared with baseline, there was a general decreasing trend of vitamin B12 level at all treatment months (6, 12, 24, and 36 months) although none of the changes reached statistical significance.
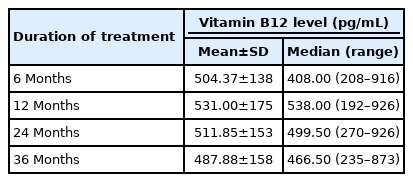
Descriptive statistics of vitamin B12 levels across time
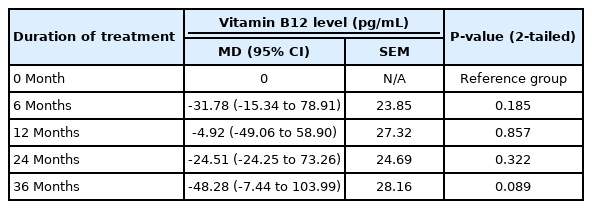
Vitamin B12 level changes across time while on metformin treatment
2. The effect of compliance on level of vitamin B12
Patients with good compliance with metformin treatment showed no significant change in vitamin B12 level at 6 and 12 months. However, a decrease in B12 level was apparent at 24 and 36 months, even though neither change was statistically significant (Table 3).
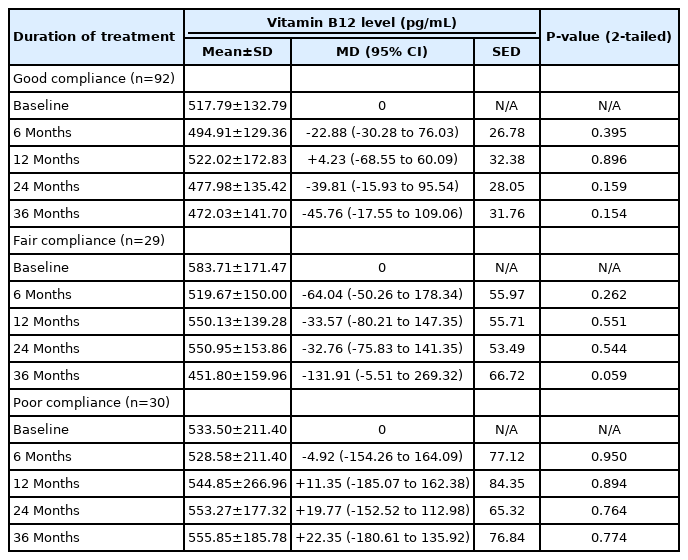
Changes in vitamin B12 across time intervals and levels of compliance
Patients with fair compliance showed minor vitamin B12 level fluctuations after up to 24 months of treatment. At 36 months, the decrease in vitamin B12 level was more pronounced at -131.91 pg/mL but still was not significant (Table 3). Similar to the groups with good and fair compliance, patients with poor compliance showed no decrease in vitamin B12 level (Table 3).
3. The effect of dosage on level of vitamin B12
There were no significant decreases in level of vitamin B12 for patients in the low-dose metformin treatment, as shown in Table 4. For patients in the high-dose group, the vitamin B12 level decreased at every treatment interval. Although the decrease was not significant at 6 or 12 months, a significant decline was observed at 24 and 36 months after treatment.

Changes in vitamin B12 across time intervals and dosage
4. The combined effect of dosage and compliance on level of vitamin B12
The combined effects of dosage and compliance also were investigated for 3 groups: high dose with good compliance, low dose with good compliance, and low dose with poor compliance. Although patients on a high dose with good compliance showed a noted decrease of vitamin B12 level at every treatment follow up, the observed decrease was significant only at 24 and 36 months, as shown in Table 5. Patients receiving a low dose with either good or poor compliance demonstrated no statistically significant changes in vitamin B12 level over time.

Changes in vitamin B12 across time intervals and levels of compliance
Discussion
Except for one case, our study showed that metformin treatment in pediatric patients did not cause vitamin B12 deficiency throughout the duration of our study (36 months). Vitamin B12 in that patient spontaneously returned to the normal range at 24 and 36 months of treatment. This indicates that the patient's temporary vitamin B12 deficiency was likely due to factors unrelated to the metformin treatment.
Our study demonstrated a mild decrease in mean vitamin B12 level for patients who received a higher dose of metformin with good compliance over a longer treatment duration. Though this is the first study in pediatric patients, similar findings were observed in an adult study. A previous study indicated a duration-dependent decrease in vitamin B12 level with metformin treatment in adult patients [1]. In that study, vitamin B12 level decreased over the treatment duration, especially when the treatment was longer than 4 years. Another study found vitamin B12 level to decrease after a short metformin treatment duration of 6–12 weeks [12], although the drop was not as drastic as that in the previous study. The maximum treatment duration in our study was 3 years. While it seems meaningful to verify the effect beyond 3 years, pediatric patients typically do not taken metformin for this length of duration because hyperglycemia commonly develops in at older pediatric age.
The cause of vitamin B12 malabsorption due to metformin treatment might be metformin-induced digestive changes that lead to difficulty of intrinsic factor (IF) binding with vitamin B12, hindering its absorption [16]. Thus, it is understandable that the higher is the dose of metformin, the greater is the interference of IF binding with vitamin B12, leading to greater vitamin B12 malabsorption and a lower level of serum B12 level over time.
Overall, our study indicates that vitamin B12 deficiency does not occur in pediatric patients receiving metformin treatment over a 3-year period. Although metformin in our study was safe, the negative effect on B12 level in our study suggests the importance of monitoring vitamin B12 level, especially when a high dose of metformin is used over an extended treatment time. Adult studies recommend vitamin B12 screening for patients prescribed metformin [17,19]. However, a study on adults has shown obvious cases of vitamin B12 deficiency [13]. Some researchers have suggested an annual vitamin B12 supplement instead of annual screening [23]. Considering the low incidence of true B12 deficiency as well as the potential for compliance issues commonly encountered in adolescents, we think that a B12 supplement should not replace B12 monitoring in the pediatric population.
The strength of our study lies in the use of patient data from real clinic environments. However, this also produces many limitations common in retrospective analysis, with no control of individual variations over dosage compliance as well as other underlying conditions. Along with the concern about B12 level, the effects of long-term metformin treatment on hemoglobin, hematocrit, and homocysteine levels as well as possible neuropathy remain unknown. As our study is retrospective and complete blood count homocysteine level was not routinely measured in patients treated with metformin, these data are lacking and could not be assessed. There was no report of neuropathy from any of our study subjects. A prospective study should be designed to examine the dose and duration effects in a controlled manner as well as possible effects on hemoglobin, hematocrit, and homocysteine levels.
Our study suggests that metformin treatment in pediatric patients is generally safe and does not play a significant role in vitamin B12 deficiency. However, a mild decrease in vitamin B12 level in patients receiving higher metformin dose over a longer treatment duration calls for caution in pediatric populations. This finding suggests benefits in monitoring pediatric serum vitamin B12 level, especially when using a high dose for longer duration. This suggestion is reinforced by the increasingly common use of metformin among obese children with metabolic problems such as T2DM [3,4,8,9,24].
Ethical statement
This study was approved by the Institutional Review Boards at Nemours Children’s Hospital (IRB No. 775776-1) and the University of Central Florida (SBE-15-11616).
Notes
Conflicts of interest
No potential conflict of interest relevant to this article was reported.
Funding
This study received no specific grant from any funding agency in the public, commercial, or not-for-profit sectors.
Author contribution
Conceptualization: YMY; Data curation: YMY; Formal analysis: YMY; Funding acquisition: SS; Project administration: YMY; Visualization: YMY; Writing - original draft: YMY; Writing - review & editing: YMY, SS, BK
Acknowledgements
We thank the Nemours' EPIC team for extracting patient data from the electronic medical records. We thank the faculty and staff at the University of Central Florida, College of Medicine, and the Focused Inquiry Research Experience (FIRE) Module for their feedback and support at the early stages of this project. We also thank Timothy Maul and Stuart Chalew for reviewing our manuscript and providing suggestions.