Basal serum luteinizing hormone value as the screening biomarker in female central precocious puberty
Article information

Abstract
Purpose
Precocious puberty refers to the development of secondary sex characteristics before ages 8 and 9 years in girls and boys, respectively. Central precocious puberty (CPP) is caused by premature activation of the hypothalamus-pituitary-gonadal (HPG) axis and causes thelarche in girls before the age of 8. A gonadotropin-releasing hormone (GnRH) stimulation test is the standard diagnostic modality for diagnosing CPP. However, the test cannot always be used for screening because it is expensive and time-consuming. This study aimed to find alternative reliable screening parameters to identify HPG axis activation in girls <8 years old (CPP) and for girls 8–9 years old (early puberty, EP).
Methods
From January 2013 to June 2015, medical records from 196 girls younger than 9 years old with onset of breast development were reviewed, including 126 girls who had a bone age (BA) 1 year above their chronological age. All patients underwent a GnRH stimulation test, and 117 underwent pelvic sonography. The girls were divided into 4 groups based on age and whether the GnRH stimulation test showed evidence of central puberty. Subanalyses were also conducted within each group based on peak luteinizing hormone (LH) level quartiles.
Results
Basal serum LH level was the most sensitive marker for screening CPP and EP. The cutoff values were 0.245 IU/L for CPP under 8 years old (P=0.049, area under the curve [AUC]=0.764, 88% sensitivity, 48% specificity) and 0.275 IU/L for EP between 8–9 years old (P=0.005, AUC=0.813, 79% sensitivity, 77% specificity). Peak LH level decreased as BMI z-score among subgroups increased when there was no difference in BA; however, higher BA eliminated this effect.
Conclusions
Basal serum LH level is a useful screening parameter for diagnosing CPP and EP in girls. Peak LH levels were lower with increasing BMI z-score, although older BA eliminated this effect.
Introduction
Precocious puberty is the development of secondary sex characteristics before ages 8 and 9 years old in girls and boys, respectively. Central precocious puberty (CPP) is caused by premature activation of the hypothalamus-pituitary-gonadal (HPG) axis. In girls, premature thelarche can be the first sign of CPP, and it can be confirmed by the gonadotropin-releasing hormone (GnRH) stimulation test, which detects advancing bone age (BA) or elevated luteinizing hormone (LH) levels. In the United States, CPP is prevalent in approximately 1 in 5,000–10,000 [1], however, recent studies have reported an increasing CPP prevalence worldwide [2-4]. In addition to endocrine disruptors, improved nutrition and hygiene are thought to contribute to increased CPP incidence [5]. Age at menarche and epiphyseal closure can be earlier in patients with CPP, which could result in shortened adult height and adverse psychosocial effects [5-7]. Therefore, early CPP diagnosis and treatment are important.
The GnRH stimulation test is considered the gold standard for diagnosing CPP. However, this test is expensive and timeconsuming to perform [8,9]. Many previous studies used basal LH, basal follicle-stimulating hormone (FSH), and ultrasonography for CPP screening, but there are disagreements regarding the appropriate cutoff values [10-16]. Therefore, we aimed to identify a reliable screening method for confirming HPG axis activation in girls <8 years (CPP) and between 8 and 9 years (early puberty, EP).
Materials and methods
1. Subjects
Initially, 169 girls who visited the Department of Pediatrics, Dankook University Hospital for evaluation of premature thelarche were included. All were <9 years old and showed advanced BA over chronological age (CA). They all underwent a GnRH stimulation test between January 2013 and June 2015. Of the 169 patients, 126 had a BA that was more than 1 year above their CA.
None of the girls had hirsutism or other underlying endocrine diseases, congenital anomalies, or organic brain diseases. They also did not have histories of drug ingestion or hormonal therapy prior to testing.
Finally, the 126 children with BA>1 year beyond CA were included in the study. The requirement to obtain consent was waived because the study was a retrospective review of anonymized laboratory results and medical data.
2. Study design
Patients were classified into 4 groups according to their baseline CA at evaluation and their GnRH stimulation results. Those with a CA <8 years on evaluation were placed into group I, and those with a CA between 8 and 9 years were categorized into group II.
Meanwhile, patients with peak LH levels ≥5 IU/L during GnRH stimulation testing in groups I and II were diagnosed with CPP (group Ia) and EP (group IIa), respectively, and placed in the appropriate pubertal groups (Fig. 1). Those with peak LH level <5 IU/L were placed in the non-CPP (group Ib) or non-EP (group IIb) categories, which were the prepubertal groups.
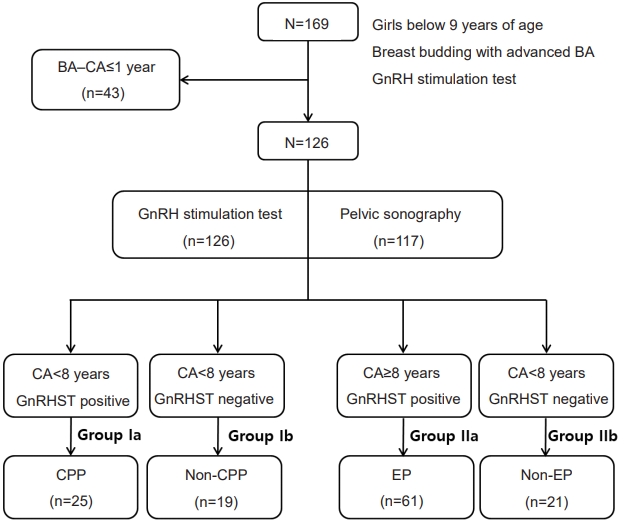
Study design. BA, bone age; CA, chronological age; GnRH, gonadotropin-releasing hormone; GnRHST, GnRH stimulation test; CPP, central precocious puberty; EP, early puberty.`
We then categorized pubertal groups (Ia + IIa) into four subgroups according to peak LH quartile, with a peak LH range as follows: subgroup I: 1st quartile (peak LH: 5.05–8.01 IU/L; n=22), subgroup II: 2nd quartile (peak LH: 8.06–13.12 IU/L; n=22); subgroup III: 3rd quartile (peak LH: 13.14–23.65 IU/L; n=21); and subgroup IV: 4th quartile (peak LH: 23.71–71.00 IU/L; n=21).
Medical records were reviewed to collect data on height, weight, body mass index (BMI), and parental height. BA results were determined by hand radiography, and uterine and ovary volumes were determined by pelvic sonography; these results were then reviewed. The serum levels of basal LH, FSH, oestradiol,17α-hydroxyprogesterone (17-OHP), dehydroepiandrosterone sulfate (DHEA-S), and insulin-like growth factor-1 (IGF1) were also reviewed.
Additionally, CPP and EP patients were classified into 4 subdivided groups according to peak LH quartiles for comparison with BMI z-scores and BA.
3. BA measurement
To measure BA, a radiograph of the left hand was evaluated by two experienced physicians—pediatric radiologist and a pediatric endocrinologist—who used the Greulich and Pyle method.
4. GnRH stimulation test
Blood samples were initially obtained to measure basal serum LH, FSH, and estradiol, and then LH and FSH were measured 30, 45, 60, and 90 minutes after administration of 100 μg of gonadorelin acetate (Relefact; Sanofi-Aventis, Frankfurt, Germany). The highest values were recorded as patients' peak LH and peak FSH values. LH and FSH were measured via immunoradiometric assays (Wallac Wizard 1470 Gamma Counter; GMI, MN, USA), which can evaluate within the following ranges: 0.1–155 IU/L for LH and 0.1–129 IU/L for FSH.
5. Pelvic sonography
A total of 117 of the 126 girls underwent transabdominal pelvic sonography with a full bladder using a 5–2-MHz curved probe (iU21, Phillips, The Netherlands), performed by one experienced radiologist. Uterine length was measured from the fundus to the external opening at the maximum length of the midsagittal section in an anteroposterior direction. Ovary volume was estimated using the ellipse formula (length×height×transverse diameter×0.5233) [14], and the side of the ovary was noted.
6. Statistical analyses
Results were presented as means±standard deviations and with minimum to maximum values. The Mann-Whitney U-test was used to compare each parameter between the CPP and non-CPP subjects in group I and between EP and non-EP subjects in group II.
Univariate and stepwise multivariate logistic regression analyses were performed to identify risk factors for CPP and EP and estimate their odds ratios. Receiver operating characteristic (ROC) analysis was used to investigate the predictive capability of basal serum LH and FSH levels. Oneway analysis of variance (ANOVA) was used to compare demographic and clinical parameters of pubertal states between CPP and EP patients according to peak LH quartiles. Post hoc analyses were performed with Tukey test. All statistical analyses were performed using IBM SPSS Statistics ver. 20.0 (IBM Co., Armonk, NY, USA). A P-value <0.05 was considered significant.
Results
1. Patient characteristics
The clinical and laboratory characteristics of 126 female patients are described in Table 1. Twenty-five (56.8% of group I) patients were diagnosed with CPP (group Ia), and 61 (74.3% of group II) patients had EP (group IIa).

Characteristics of each groups
2. Analysis of basal serum LH and FSH in group I (CPP [Ia] vs. non-CPP [Ib]) and group II (EP [IIa] vs. non-EP [IIb])
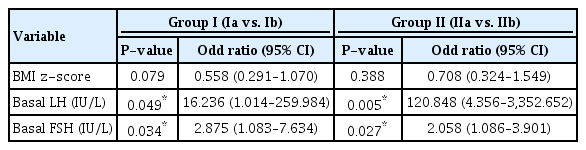
The mean values for weight, BMI z-score, DHEA-S, basal LH, basal FSH, peak LH, and peak FSH were significantly different between groups Ia and Ib. BMI z-score was lower in group Ia compared to group Ib (P<0.05), whereas DHEA-S was not significantly different in univariate logistic regression analysis (Supplementary Table 1). Stepwise multivariate logistic regression showed that basal LH (odds ratio [OR], 16.236; 95% confidence interval [Cl], 1.014–259.984; P=0.049) and basal FSH (OR, 2.875; 95% Cl, 1.083–7.634; P=0.034) are good markers for screening and diagnosing CPP (P<0.05) (Table 2).
Stepwise multivariate analysis of factors associated with peak LH values
In group II, there were significant differences in the mean values for DHEA-S, basal LH, basal FSH, peak LH, and peak FSH between groups IIa and IIb in univariate regression analyses. By contrast, BA, uterine length, and ovary volumes were not significantly different between the 2 groups (Table 1). Stepwise multivariate logistic regression showed that basal LH (OR, 120.848; 95% Cl, 4.356–3,352.652; P=0.005) and basal FSH (OR, 2.058; 95% Cl, 1.086–3.901; P=0.027) were significantly different between groups IIa and IIb (Table 2).
3. Analysis of basal LH and FSH in the pubertal (Ia+IIa) and prepubertal (Ib+IIb) groups
There were significant differences between group Ia + IIa and group Ib+IIb in terms of BMI, BMI z-score, basal LH, basal FSH, DHEA-S, peak LH, and peak FSH. Univariate logistic regression analyses showed significant differences in larger ovary volume (P=0.042), but the mean values were not significantly different (Supplementary Tables 2 and 3). In stepwise multivariate logistic regression, basal LH (OR, 81.353; 95% Cl, 6.848–966.476; P=0.000), basal FSH (OR, 1.873; 95% Cl, 1.019–3.441; P=0.043), and larger ovary volume (OR, 1.987; 95% Cl, 1.124–3.513; P=0.018) were significantly different (Table 3).
Stepwise multivariate logistic analysis of factors associatedwith pubertal response (in GnRH stimulation test)
4. Decisions for cutoff values
To evaluate basal LH and FSH as screening parameters for CPP and EP, cutoff values were assessed using ROC curve analysis. Using Youden’s index (J), sensitivity, and specificity measures, we selected the best values for screening.
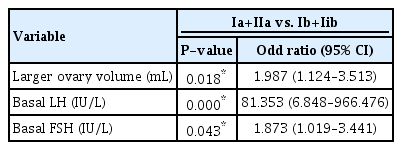
For CPP screening in girls <8 years, a basal LH cutoff of 0.245 IU/L yielded an area under the curve (AUC) of 0.764, 88% sensitivity, 48% specificity, 69% positive predictive value (PPV), and 75% negative predictive value (NPV). A basal FSH cutoff value of 1.160 IU/L had an AUC of 0.706, 92% sensitivity, 43% specificity, 67% PPV, and 80% NPV (Fig. 2A).
Receiver operating characteristic (ROC) curve and cutoff value for CPP and EP screening. (A) ROC curve for CPP screening of patients <8 years. (B) ROC curve for EP screening of patients 8–9 years. (C) ROC curve for CPP+EP screening of patients <9 years. CPP, central precocious puberty; EP, early puberty; AUC, area under curve; Sn, sensitivity; Sp, specificity; PPV, positive predictive value; NPV, negative predictive value; J, Youden’s index. LH, luteinizing hormone; FSH, follicle-stimulating hormone.
For EP screening in girls 8–9 years, a basal LH cutoff value of ≥0.275 IU/L yielded an AUC of 0.813, 79% sensitivity, 77% specificity, 87% PPV, and 54% NPV. Meanwhile, a basal FSH cutoff value of 1.165 IU/L had an AUC of 0.761, 87% sensitivity, 52% specificity, 84% PPV, and 58% NPV (Fig. 2B).
In girls <9 years, for CPP and EP screening, a basal LH cutoff value of >0.245 IU/L yielded an AUC of 0.792, 88% sensitivity, 44% specificity, 77% PPV, and 63% NPV, and a basal FSH cutoff value of ≥1.165 IU/L yielded an AUC of 0.763, 90% sensitivity, 50% specificity, 78% PPV, and 66% NPV. A larger ovary cutoff value of >1.67 mL yielded an AUC of 0.611 62% sensitivity, 61% specificity, 77% PPV, and 40% NPV.
5. Analyses according to peak LH quartile in the pubertal group (Ia+IIa)
The mean values for all variables were compared via 1-way ANOVA across each subgroup (Supplementary Table 4). CA, BMI, BMI z-score, BA, uterine length, larger ovary volume, IGF1, and basal LH were significantly different between the subgroups. In Tukey honestly significant difference post hoc method, mean BMI z-score was significantly different between subgroups I and III (z=0.74, standard deviation [SD]=0.27, P=0.036) and between subgroups III and IV (z=-0.84, SD=0.27, P=0.014) (Fig. 3A). BA was significantly different between subgroups I and IV at 0.77 years (SD=3.319, P=0.035) (Fig. 3B). BA–CA was not significantly different between each of the subgroups (Fig. 3C).
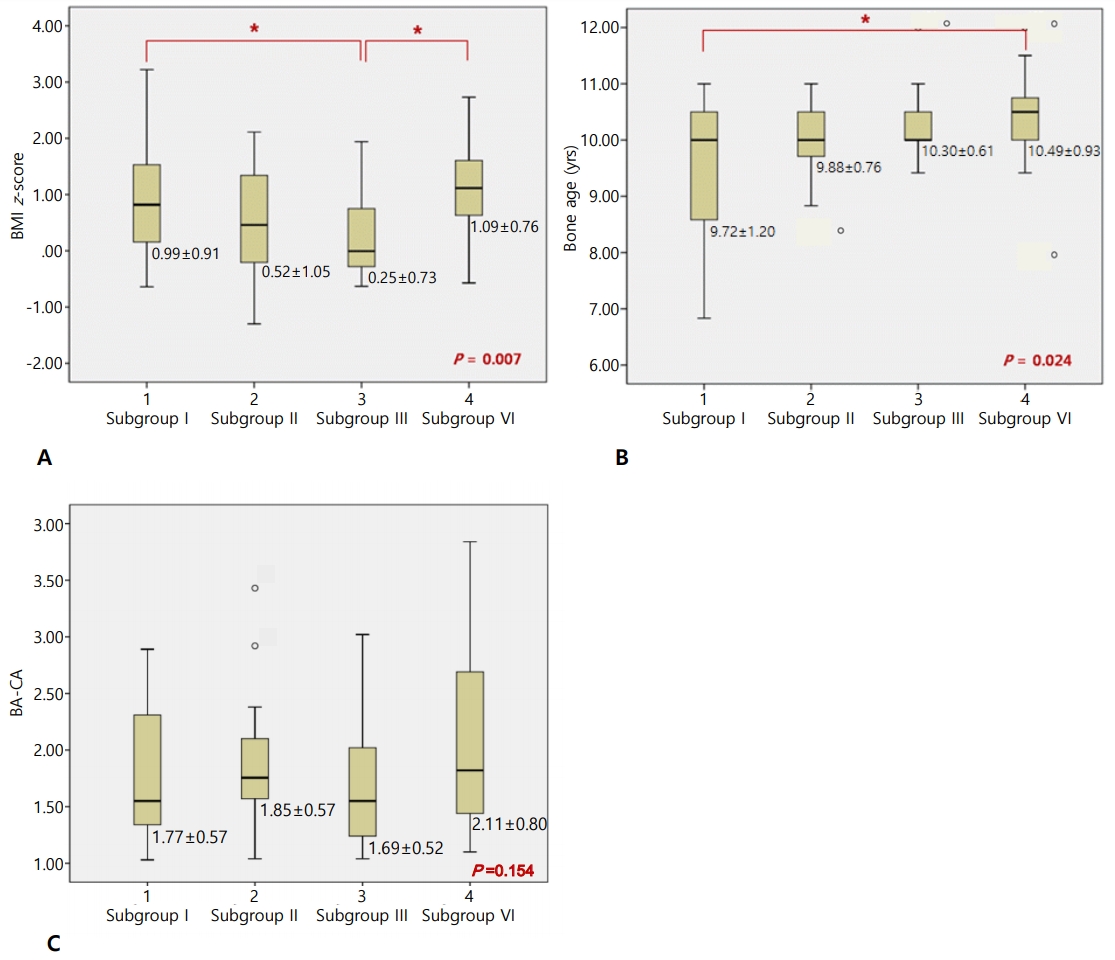
Analyses of pubertal group according to luteinizing hormone peak quartiles. Body mass index (BMI) z-score for each group. (A) BA for each group. (B) BA–CA for each group. BA, bone age; CA, chronological age. *P<0.05
Discussion
Early diagnosis of CPP and EP in girls <8 and 8–9 years, respectively, is important. Random serum basal LH and FSH values are commonly used for early diagnosis of these conditions; however, a clear consensus regarding cutoff values has not been established. We observed that basal LH >0.1 IU/L had 56.4%–94.7% sensitivity and 64%–88.4% specificity for CPP [12,17,18]. The AUC, sensitivity, specificity, PPV, and NPV of basal LH were similar to those reported in previous studies. Suh et al. [19] reported a sensitivity and specificity of 87.8% and 20.9%, respectively, when the basal LH cutoff value was >0.22 IU/L. In our study, the cut-off levels of basal LH for CPP and EP screening were ≥0.245 IU/L and ≥0.275 IU/L, respectively (Fig. 2).
Previous studies have also reported that basal FSH can be used for CPP diagnosis [12,13]. Pasternak et al. [12] reported a sensitivity of 76% and specificity of 73% for a basal FSH cutoff of >2.25 IU/L for CPP diagnosis. Çatlı et al. [13] reported a sensitivity of 71% and specificity of 68% for a cut-off value >1.9 IU/L for CPP diagnosis. In our study, we found that basal FSH and LH are effective screening parameters for CPP and EP, respectively, when the cutoff value for basal FSH for CPP screening was >1.160 IU/L and the cutoff value for basal FSH for EP screening was ≥1.165 IU/L.
Çatlı et al. [13] also reported 100% sensitivity and 84% specificity when using peak LH/FSH ratio for CPP diagnosis. Supornsilchai et al. [20] reported a sensitivity, specificity, PPV, and NPV of 75%, 85%, 82%, and 82%, respectively, for CPP diagnosis when the basal LH/FSH ratio cutoff level was >0.2, however, the difference in basal and peak LH/FSH levels between the CPP and non-CPP groups was not statistically significant in univariate analyses.
Several studies have reported on the usefulness of ultrasound for CPP diagnosis [14-16]. Yu et al. [14] reported that uterine length, transverse diameter, fundus, volume, and cross-sectional area were significantly larger on ultrasound in CPP patients (uterine length: 2.45±0.50 cm vs. 2.63±0.49 cm, P=0.015; uterine volume: 0.95±0.62 cm3 vs. 1.35±0.76 cm3, P<0.001). However, these parameters are not useful for diagnostic purposes because they overlap. In a study by Lee et al. [15], the best ultrasound parameter to predict CPP among 192 CPP children <8 years was uterine volume at a cutoff value of 3.30 mL, with a sensitivity and specificity of 64.18% and 71.79%, respectively. Additionally, uterine length (cutoff=4.09 cm) and ovary volume (cutoff=3.5 mL) have also been reported as useful parameters. De Vries et al. [16] reported a sensitivity of 88.8% and a specificity of 89.4% for predicting CPP when the uterine volume cut-off was 2.0 mL. Uterine length (cutoff=3.4 cm, 80.2% sensitivity, 57.8% specificity) was also a good CPP predictor. In this study, 117 patients underwent pelvic sonography. There was no difference in ovary volume and uterine length between the Ia and Ib groups, nor between the IIa and IIb groups. Moreover, the mean values of ovary volume and uterine length were also not significantly different between the Ia+IIa and the Ib+IIb groups. However, univariate and multivariate logistic regression analyses indicated that ovary size was significantly different between the Ia and Ib groups and the IIa and IIb groups, indicating that in addition to basal FSH and LH, a larger ovary can also be used for CPP and EP screening. The cutoff value of larger ovary volume for CPP and EP screening was 1.67 mL with 62% sensitivity and 61% specificity.
Higher BMI is associated with a lower LH response to the GnRH stimulation test in boys and girls with CPP [21,22]. In this study, the Ia and IIa groups were divided into four subgroups according to peak LH quartile, and each subgroup was compared and analyzed. CA, BA, uterine length, IGF1, and basal LH levels increased proportionally with peak LH, indicating that the pubertal process progresses with increasing age. Larger ovary volumes tended to be proportional to peak LH, although the mean values in subgroup II were smaller than those in subgroup I without a statistically significant difference in post hoc analysis.
Among CPP children, studies of GnRH-stimulation tests for early pubertal stages showed a lower LH response with higher BMI but no response association was observed as pubertal stage increased [21,23]. In this study, BMI and BMI z-score tended to be lower in subgroups I, II, and III when peak LH was higher, but the BMI z-score was higher in subgroup IV, which had the highest peak LH. BMI z-score was significantly different (P=0.007) according to ANOVA results for subgroups I and III, although BA was not different (Fig. 3A, B). Mean BMI z-scores were significantly different between subgroups I and III and between subgroups III and IV, suggesting that peak LH response was weaker in the presence of higher BMI z-scores when BA was not significantly different. In subgroup IV, BA was significantly higher than in subgroup I and peak LH levels also showed higher values than subgroup I, suggesting that increased BA eliminates the lower LH response during a GnRH stimulation test in the presence of increased BMI z-score. BACA was not different among the subgroups (Fig. 3C).
A limitation of this study is that it was performed at a singlecenter and included a small number of patients.
In conclusion, we found that basal serum LH, basal serum FSH, and larger ovary volume can be used for CPP and EP screening. In particular, random basal LH values are useful for CPP screening among girls <8 years and for EP screening among girls 8–9 years. The cutoff values of basal serum LH are 0.245 IU/L for CPP and 0.275 IU/L for EP. Additionally, basal serum FSH and larger ovary volume on ultrasonography may also be useful screening parameters for CPP and EP. Moreover, we also found that as BMI z-score increases, peak LH response was reduced in EP stages, although higher BA eliminates the effect. However, the extent to which BA impacts this phenomenon is unclear, and further studies are needed. Given that peak LH value on GnRH stimulation tests is masked by higher BMI, GnRH stimulation test results should be interpreted cautiously in obese patients.
Notes
Ethical statement
This study was approved by the Institutional Review Board of Dankook University Hospital (DKUH 2016-10-006).
Conflict of interest
No potential conflict of interest relevant to this article was reported.
Supplementary material
Supplementary Tables 1-4 can be found via http://doi.org/10.6065/apem.2019.24.3.164.