Change in body mass index and insulin resistance after 1-year treatment with gonadotropin-releasing hormone agonists in girls with central precocious puberty
Article information

Abstract
Purpose
Gonadotropin-releasing hormone agonist (GnRHa) is used as a therapeutic agent for central precocious puberty (CPP); however, increased obesity may subsequently occur. This study compared body mass index (BMI) and insulin resistance during the first year of GnRHa treatment for CPP.
Methods
Patient group included 83 girls (aged 7.0–8.9 years) with developed breasts and a peak luteinizing hormone level of ≥5 IU/L after GnRH stimulation. Control group included 48 prepubertal girls. BMI and insulin resistance-related indices (homeostasis model assessment of insulin resistance [HOMA-IR] and quantitative insulin sensitivity check index [QUICKI]) were used to compare the groups before treatment, and among the patient group before and after GnRHa treatment.
Results
No statistical difference in BMI z-score was detected between the 2 groups before treatment. Fasting insulin and HOMA-IR were increased in the patient group; fasting glucose-to-insulin ratio and QUICKI were increased in the control group (all P<0.001). In normal-weight subjects in the patient group, BMI z-score was significantly increased during GnRHa treatment (−0.1±0.7 vs. 0.1±0.8, P<0.001), whereas HOMA-IR and QUICKI exhibited no differences. In overweight subjects in the patient group; BMI z-score and HOMA-IR were not significantly different, whereas QUICKI was significantly decreased during GnRHa treatment (0.35±0.03 vs. 0.33±0.02, P=0.044).
Conclusion
Girls with CPP exhibited increased insulin resistance compared to the control group. During GnRHa treatment, normal-weight individuals showed increased BMI z-scores without increased insulin resistance; the overweight group demonstrated increased insulin resistance without significantly altered BMI z-scores. Long-term follow-up of BMI and insulin resistance changes in patients with CPP is required.
Introduction
Precocious puberty is defined as developing secondary sexual characteristics before the age of 8 years for girls and 9 years for boys1). Precocious puberty can be classified into gonadotropin-releasing hormone (GnRH) dependent and GnRH independent according to the early activation of the hypothalamic-pituitary-gonadal (HPG) axis2). Laboratory confirmation for the diagnosis of central precocious puberty (CPP) is a maximal concentration of luteinizing hormone (LH) ≥5 IU/L after GnRH stimulation testing3). A depot formulation of GnRH agonist (GnRHa) has been used for the suppression of the HPG axis in subjects with CPP45).
Insulin and insulin resistance increase during puberty6). Increased insulin concentration is associated with early menarche7). Epidemiological studies have demonstrated that insulin resistance is one of the major risk factors for diabetes and cardiovascular disease89). On the contrary, insulin sensitization delayed the age at puberty, as well as the tempo of pubertal progression10). As a biochemical marker of insulin resistance and sensitivity, hyperinsulinemic-euglycemic glucose clamp test is regarded as a gold standard11). However, this procedure cannot be routinely applied due to the requirement of frequent sampling. Various methods were developed to substitute the clamp technique, including a minimal model analysis of a frequently sampled intravenous glucose tolerance test, homeostasis model assessment of insulin resistance (HOMA-IR), quantitative insulin sensitivity check index (QUICKI), fasting insulin and fasting glucose-to-insulin ratio (FGIR), which have demonstrated good correlations with the hyperinsulinemic-euglycemic glucose clamp test12).
Treatment with GnRHa in CPP has beneficial effects, such as increased final adult height and delayed menarcheal age. However, some studies have shown that GnRHa treatment may be associated with obesity, increased insulin resistance, hyperandrogenemia, and polycystic ovary syndrome131415). On the contrary, several studies have reported that body mass index (BMI) was not increased during GnRHa treatment, although CPP was associated with obesity16171819). A previous study revealed that obesity increased in normal-weight girls with CPP during and after GnRHa treatment; however, obesity did not change in overweight girls192021). Clinical studies performed in Korea showed that there was an increase in BMI z-scores after treatment with GnRHa in girls with CPP; however, changes in insulin resistance were not evaluated2122).
The present study aimed to compare obesity and insulin resistance between girls with CPP and prepubertal girls and to investigate change in BMI and insulin resistance indices during the first year of GnRHa treatment to elucidate the effect of GnRHa on obesity. The factors that influence the changes in obesity were analyzed.
Materials and methods
1. Subjects
The patient group included girls with CPP who began GnRHa treatment at the age of 7.0–8.9 years between January 2013 and December 2014. CPP was defined when breasts developed before the age of 8 years, bone age was advanced compared to chronological age, and peak LH concentration was ≥5 IU/L after GnRH stimulation testing. Subjects were regarded as eligible if they were administered the depot formulation of GnRHa for at least 1 year, with a dose of 60–90 mcg/kg injected subcutaneously or intramuscularly every 4 weeks. Exclusion criteria included underlying diseases that could affect obesity (growth hormone deficiency or untreated thyroid disease) and administration of recombinant human growth hormone for the purpose of height gain. Following the exclusion of 2 subjects due to growth hormone administration, 83 subjects were enrolled in the patient group.
The control group included prepubertal girls aged 7.0–8.9 years. Those who exhibited a basal LH concentration >0.3 IU/L, had a 3-year- or more discrepancy between chronological age and bone age, or had endocrine disorders were excluded. A total of 48 prepubertal girls were included as the control group after the exclusion of three subjects (1 with basal LH concentration >0.3 IU/L, and 2 with bone age advancement).
This study was approved by the Institutional Review Board of Inje University Ilsan Paik Hospital (IB-1312-052). Informed consent was waived by the patient group and was obtained from subjects in the control group and their legal guardians. All procedures were performed in accordance with the Declaration of Helsinki.
2. Methods
Data from the patient group were collected by a retrospective review of medical records. Anthropometric data before and after 1 year of GnRHa treatment were collected, including height, weight, BMI, and abdominal circumference. Height was measured using a Harpenden Stadiometer (Holtain. Ltd., Crosswell, UK) and weight was measured using an electric balance (150A; CAS Co. Ltd., Seoul, Korea). BMI was calculated as weight (kg) divided by height (m) squared. Waist circumference was measured on the midpoint between the lowest rib and upper margin of the iliac crest. Waist-to-height ratio was calculated as waist circumference divided by height. Height, weight, and BMI were transformed into a z-score using the 2007 Korean National Growth Chart23). Overweight was defined as a BMI between the 85th and 94th percentile for age and sex, and obesity as a BMI in the ≥95th percentile for age. Abdominal obesity was defined as an waist circumference in the ≥90th percentile for age and sex. Bone age was evaluated using the Tanner-Whitehouse 3 method by a single pediatric endocrinologist24).
In the patient group, GnRH stimulation testing was performed following an overnight fast for the diagnosis of CPP. Baseline samples for LH, follicular stimulating hormone (FSH), estradiol, glucose, and insulin were drawn immediately prior to intravenous injection of 100 µg GnRH (Relefact; Sanofi-Aventis, Frankfurt, Germany). Blood samples for LH and FSH were obtained at 30, 45, 60, and 90 minutes after GnRH administration. After 1 year of GnRHa treatment, serum LH, FSH, estradiol, glucose, and insulin were evaluated after an overnight fast.
In the control group, height, weight, BMI, abdominal circumference, and bone age were evaluated as described. Serum glucose, insulin, LH, FSH, and estradiol were measured after an overnight fast.
Serum glucose was measured via the hexokinase G-6-PDH method (AU Glucose; Beckman Coulter, Brea, CA, USA). Insulin, LH, FSH, and estradiol levels were measured using a chemiluminescence immunoassay (Elecsys Insulin; Roche Diagnostics GmbH, Mannheim, Germany).
Indices used to evaluate insulin resistance and sensitivity, including HOMR-IR, QUICK, and FGIR, were calculated as follows: HOMA-IR = fasting insulin (µIU/mL) × FPG (mmol/L)/22.5; QUICKI = 1/[log (fasting insulin, µIU/mL) + log (fasting glucose, mg/dL)]; and FGIR = fasting glucose (mg/dL)/fasting insulin (µIU/mL)12).
3. Statistics
Statistical analyses were performed using Stata 14.1 (StataCorp LP, College Station, TX, USA). Data were presented as mean±standard deviation. Continuous baseline variables between the patient group and the control group were compared by Student t-test. Paired t-test was applied to compare variables between the baseline and 1 year after GnRHa treatment in the patient group. Categorical variables were evaluated by chi-square test. Linear regression analysis was performed to identify factors affecting obesity and insulin resistance. P<0.05 was considered to be statistically significant.
Results
1. Characteristics of the study participants at baseline (Table 1)
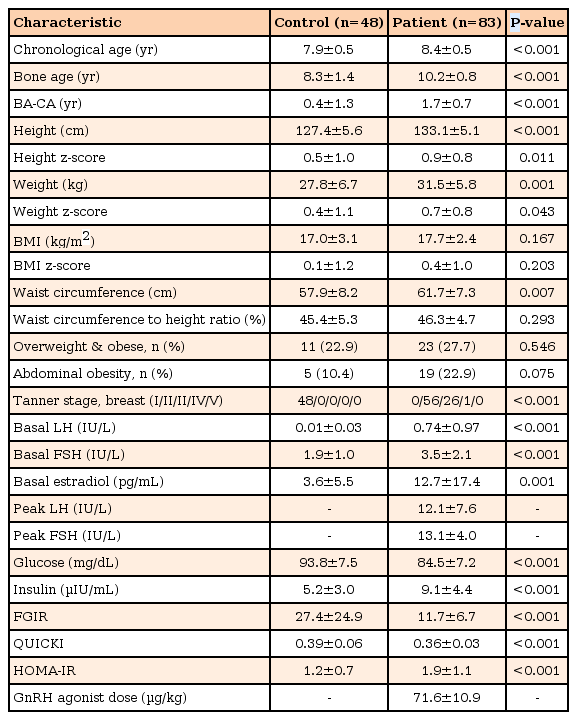
Baseline clinical and biochemical characteristics of study participants
The present study investigated 83 subjects in the patient group and 48 in the control group. Mean chronological age was 8.4±0.5 years in the patient group and 7.9±0.5 years in the control group (P<0.001). Bone age, difference between bone age and chronological age, and height z-score were significantly increased in the patient group (all P<0.001). However, BMI z-score and waist-to-height ratio were not significantly different between the 2 groups (P=0.203 and P=0.293, respectively).
Overweight and obese subjects in the control and patient groups were 11 (22.9%) and 23 (27.7%), respectively, which showed no statistical difference (P=0.546). Abdominal obesity between the 2 groups demonstrated a marked difference (P=0.075). Serum glucose, FGIR and QUICKI were significantly increased in the control group (all P<0.001), whereas insulin and HOMA-IR were significantly higher in the patient group (all P<0.001).
2. Changes during the first year of GnRHa treatment (Table 2)

Clinical and biochemical characteristics of patients before and 1 year after GnRH agonist treatment
In the patient group, the difference in bone age-chronological age decreased significantly after a year of treatment (1.7±0.7 vs. 1.3±0.8, P<0.001). Within a year of treatment, there was no significant change in height z-score (P=0.362), whereas BMI z-score and waist-to-height ratio significantly increased within a year of treatment (P<0.001). However, the number of overweight and obese girls and those with abdominal obesity did not exhibit significant differences during the first year of GnRHa treatment. Fasting glucose and FGIR notably increased; however, insulin, HOMA-IR and QUICKI did not demonstrate a significant difference (Fig. 1.)

Changes of insulin resistance indices according to body mass index categories during gonadotropin-releasing hormone agonist treatment (*P<0.05). HOMA-IR, homeostasis model assessment of insulin resistance; SD, standard deviation; QUICKI, quantitative insulin sensitivity check index; FGIR, fasting glucose-to-insulin ratio.
3. Comparing changes in the patient group according to BMI category (Table 3)
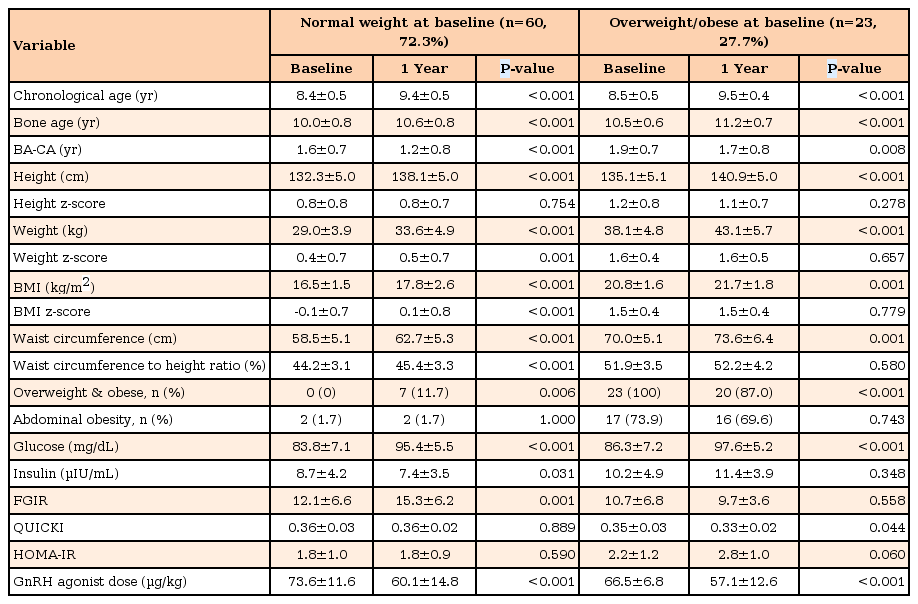
Clinical and biochemical characteristics of subjects with GnRH agonist treatment according to BMI categories
In the patient group, 60 subjects (72.3%) were of a normal weight and 23 (27.7%) were overweight and obese at the baseline. Normal-weight subjects exhibited increased BMI z-score, waist-to-height ratio, fasting glucose, FGIR and decreased insulin. However, HOMA-IR and QUICKI showed no significant difference after GnRHa treatment.
No statistical difference in BMI z-score, waist-to-height ratio, insulin, and FGIR was detected in overweight and obese subjects between baseline and one year after GnRHa treatment. However, fasting glucose and QUICKI were significantly increased during GnRHa treatment. HOMA-IR showed a marked, but insignificant, difference (2.2±1.2 vs. 2.8±1.0, P=0.060).
Seven patients became overweight/obese during the course of treatment, according to BMI. Notably, 3 patients who were overweight/obese at the beginning of the treatment period subsequently reduced to a normal weight. After a year of treatment, the number of obese patients increased, but this difference was not statistically significant (Fig. 2). Three patients who were of a normal weight at the beginning of the treatment subsequently developed abdominal obesity, whereas four patients who initially were abdominally obese became normal weight. Although the number subjects with abdominal obesity decreased, this difference was not statistically significant (Fig. 2).
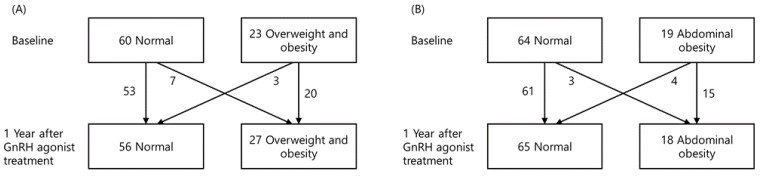
Change in obesity during the first year of gonadotropin-releasing hormone agonist (GnRH) treatment according to body mass index (A) and waist circumference (B).
Within the normal-weight and overweight/obese groups, ΔBMI z-score was 0.2±0.4 and 0.0±0.3 (P=0.009), respectively. The difference in height z-score and waist-to-height ratio during the first year of GnRHa treatment exhibited no significant changes.
4. Analysis of the factors that affect obesity and insulin resistance incidence within the patient group
As a factor that affects changes in the number of obese patients (ΔBMI z-score), the BMI z-score at the baseline of the GnRHa treatment exhibited negative correlation with treatment. (R-square=0.05, P=0.003) (Fig. 3). Factors that affect ΔHOMA-IR or ΔQUICKI were not observed (data not shown).
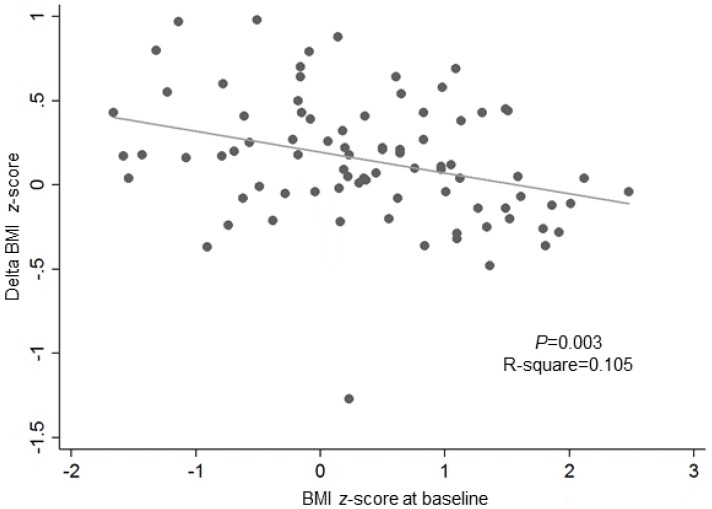
Correlation between body mass index (BMI) z-score at baseline and the change in BMI z-score during the first year of gonadotropin-releasing hormone agonist treatment.
Discussion
In conclusion, the present study investigated the effect of GnRHa treatment on obesity and insulin resistance in girls with precocious puberty; the patient group exhibited an increase in BMI z-score and waist-to-height ratio during a year of treatment, whereas there were no changes in HOMA-IR and QUICKI. However, by comparing the number of obese patients between the patient and control groups before GnRHa treatment, the patient group exhibited increased fasting insulin, QUICKI, and HOMA-IR, which indicated high insulin resistance; however, there was no significant difference in the incidence of obesity. This result suggested that insulin resistance had already increased in the patient group compared with the control group before GnRHa treatment. Within the patient group, normal-weight and overweight individuals exhibited different results. In normal-weight individuals, BMI z-score, and waist-to-height ratio increased after treatment, but showed no changes in insulin resistance. In overweight individuals, there were no changes in BMI z-score and waist-to-height ratio, whereas QUICKI decreased and HOMA-IR marginally increased, which suggests an increase in insulin resistance.
GnRHa is used to treat CPP by effectively delaying menarche by suppressing the progression of puberty and an increase in final adult height. However, several reports have demonstrated that treatment with GnRHa for CPP was associated with an increase in obesity. Sørensen et al.25) reported that a year of GnRHa treatment increased BMI from 18.1 to 18.6 kg/m2. According to Anik et al.16), GnRHa treatment did not induce significant changes in BMI z-score for chronological age, but it increased BMI z-score for bone age from 0.4±0.8 to 0.8±0.7 (P<0.001), whereas the percentage of overweight/obese CPP patients increased from 59.4% to 65.7% after a year of treatment (P<0.001). According to Yoon et al.22), BMI z-score increased from 0.26±1.03 to 0.42±0.89 during a year of GnRHa treatment in Korean girls with CPP. Lee et al.21) reported that BMI z-score of a Korean girl with CPP significantly increased from 0.58±1.18 to 0.96±0.83 after 18 months of GnRHa treatment.
Several studies have demonstrated that GnRHa treatment in CPP patients did not affect obesity. According to Pasquino et al.18), a CPP patient group that had been treated with GnRHa exhibited BMI z-score for chronological age in the beginning, end of treatment, follow-up after end of treatment of 0.39±0.8, 0.41±0.9, and 0.44±1.0, respectively, which were not significant different. Likewise, Arrigo et al.26) observed CPP patients before GnRHa treatment, before the end of treatment, and after the treatment with long-term surveillance, and they found that BMI z-score consistently decreased (1.39±1.07 vs. 0.61±0.79 vs. 0.11±0.52, P<0.0005). While the majority of CPP patients were obese during the treatment, it was noted the GnRHa treatment did not further induce obesity. Furthermore, the ratios of obese patients at the start of treatment, end of treatment, and during follow-up of the treatment were 23.2%, 4%, 0%, demonstrating a decrease in the number of obese patients.
Moreover, there have been reports where the result of the treatment varied according to the obesity status of the patient. According to Wolters et al.20), patients who were normal-weight at the start of the treatment, exhibited an increase in BMI z-score (0.08±1.02 at baseline vs. 0.40±0.85 at the end of treatment vs. 0.41±0.89 at 6-month follow-up). In the overweight group, there was an insignificant change in BMI z-score (2.01±0.69 at baseline vs. 2.03±0.54 at the end of treatment vs. 1.99±0.51 at 6 months after the end of treatment). In the present study, the number of patients who became obese after initially being classified into the normal-weight BMI category increased from 23 to 27, whereas the number of patients with abdominal obesity decreased (Fig. 2). Furthermore, amongst the 60 subjects in the normal-weight group, there were seven patients who became obese, whereas within the 23 patients in the obese group, 20 subjects were still obese after a year of treatment (Table 3, Fig. 2). This result was consistent with those of Wolters et al.20), which demonstrated a different outcome according to initial BMI status. The mechanism of dimorphic response according to BMI status before GnRHa treatment remains to be determined. However, the present study showed that GnRHa treatment invariably increased BMI z-score within a year of treatment, regardless of the subject's obesity status. The factor that affected BMI z-score within a year of GnRHa treatment included the starting BMI z-score, which showed negative correlation (Fig. 3). This result is consistent with the findings of a previous study22).
Several studies have demonstrated that injection of GnRHa caused changes in insulin resistance. Insulin resistance increases during puberty, which is related to an increase in sex hormones6). Therefore, insulin resistance increases in subjects with precocious puberty. According to Sørensen et al.14), fasting insulin, first phase insulin release and mean plasma insulin during oral glucose tolerance test in CPP patients increased after a 52-week period of GnRHa treatment, whereas whole body insulin sensitivity index decreased, indicating an increase in insulin resistance. When comparing indices between CPP patients and age-matched controls, CPP patients exhibited increased insulin resistance, and this resistance was simultaneously aggravated during the process of treatment. Also, the lipid profile exhibited an unfavorable result compared with the control group. However, there were only 15 subjects in this research, which may make it difficult to analyze the results by dividing the subjects into normal-weight and overweight groups. In the present research, no changes were observed in QUICKI and HOMA-IR within a year of treatment in the normal-weight girls with CPP. However, in the overweight and obese group, QUICKI significantly decreased (P=0.044), whereas HOMA-IR markedly increased (P=0.060). Collectively, in the normal-weight group there were no changes in insulin resistance, whereas a tendency of increased insulin resistance was detected in the overweight and obese group, which suggests that the weight of the subject at the start of the treatment may influence changes in obesity and insulin resistance. These findings demonstrated that weight management of CPP patients will vary according to the obesity status of the patient when treatment is initiated.
During puberty, sex steroids increase body fat in girls27) and increase muscle mass for boys, which have a general effect of an increase in weight28). Therefore, if administration of GnRHa decreases sex steroid, body weight is expected to decrease. However, as shown in the present study, the normal-weight group exhibited increased BMI z-score. The cause of an increase in the prevalence of obesity following GnRHa injection may be explained by an increase in leptin and insulin in overweight patients, due to the conversion of adrenal androgen to estrogen from the activation of aromatase in adipose tissue29). However, the reason for the difference in BMI z-score and indices for insulin resistance in CPP patients according to obesity status is yet to be determined. Moreover, the reason for the inconsistencies in the changes in weight and BMI in CPP patients remains unknown. Several factors may be responsible for the inconsistencies, including the absence of a control group, differences in the age and sex of the subject, and a lack of consideration for the obesity status of the subject at the beginning of treatment.
There were several limitations to the present study. Firstly, the number of subjects in the patient and control groups was not sufficient, and the follow-up period was relatively short as it was not long enough to evaluate the long-term effect of insulin resistance on the subjects. Secondly, long-term follow-up was not performed in the control group. Thirdly, HOMA-IR and QUICKI were used as indicators of insulin resistance and sensitivity, instead of the hyperinsulinemic-euglycemic glucose clamp test. Obesity was classified using BMI and waist circumference values, which do not reflect body composition precisely, compared to dual energy X-ray absorptiometry30). However, to the best of our knowledge, the present study was the first to investigate obesity and insulin resistance in Korean girls with CPP treated with GnRH.
In conclusion, no significant difference in the number of obese patients was detected between the control group and girls with CPP before treatment, although insulin resistance increased in the CPP group. Among girls with CPP, BMI z-score and waist-to-height ratio values increased, without any change in insulin resistance after a year of treatment. In overweight and obese girls with CPP, insulin resistance tended to increase without any change in BMI z-score. Therefore, different weight management approaches should be applied according to the weight status of patients with CPP prior to treatment. Long-term prospective controlled research is required to evaluate the changes in obesity and insulin resistance in subjects with CPP.
Notes
Conflict of interest: No potential conflict of interest relevant to this article was reported.