Comparison of the clinical characteristics and outcomes of pediatric patients with and without diabetic ketoacidosis at the time of type 1 diabetes diagnosis
Article information

Abstract
Purpose
We investigated the possible effects of diabetic ketoacidosis (DKA) at the initial diagnosis of type 1 diabetes mellitus (T1DM) on the clinical outcomes of pediatric patients.
Methods
Medical records of children and adolescents with newly diagnosed T1DM seen in the Ajou University Hospital from January 2008 to August 2020 were reviewed and analyzed.
Results
Among 129 diagnosed T1DM patients, 40.3% presented with DKA. Although demographic and basic characteristics did not differ between DKA and non-DKA patients, DKA patients needed a significantly higher insulin dosage than non-DKA patients for 2 years after diagnosis. However, control of glycated hemoglobin was not different between the DKA and non-DKA groups during the observation period. In the biochemical analysis, C-peptide, insulin-like growth factor-1, and insulin-like growth factor binding protein 3, high-density lipoprotein cholesterol, free T4, and T3 values were lower, but thyroid-stimulating hormone, initial serum glucose, uric acid, total cholesterol, triglyceride, and low-density lipoprotein cholesterol values were higher in DKA patients than non-DKA patients at the diagnosis of T1DM; however, these differences were temporarily present and disappeared with insulin treatment. Other clinical outcomes, such as height, thyroid function, and urine microalbumin level, did not vary significantly between the DKA and non-DKA groups during 5 years of follow-up.
Conclusions
DKA at initial presentation reflects the severity of disease progression, and the deleterious effects of DKA seem to impact insulin secretion. Although no difference in long-term prognosis was found, early detection of T1DM should help to reduce DKA-related islet damage and the socioeconomic burden of T1DM.
Highlights
· DKA patients needed a significantly higher insulin dosage than non-DKA patients for 2 years after diagnosis, which implies that DKA reflects the severity of disease progression by the deleterious effects on insulin secretion.
Introduction
Diabetic ketoacidosis (DKA) is a common clinical presentation in patients with newly diagnosed type 1 diabetes mellitus (T1DM). Approximately 15%–70% of patients in Europe and North America [1,2] and approximately 38%–49% of patients in Korea [3,4] have been observed to have DKA at the initial diagnosis of T1DM. Efforts to achieve early diagnosis and proper management to improve emergency care for DKA have been made over the years, but DKA still places considerable economic burdens and sometimes results in life-threatening events. For instance, the estimated rate of mortality resulting from hyperglycemic crises, including DKA, was reported to be 1.8% in Korea from 2004–2014 [5].
DKA results from severe insulinopenia and usually occurs under stressful conditions, inducing metabolic decompensation; however, DKA sometimes presents without a specific cause, especially at the initial diagnosis of T1DM. DKA usually indicates the severity of insulin depletion attributed to islet destruction. Severe insulin deficiency and simultaneous activation of counter-regulatory hormones such as catecholamines, glucagon, and growth hormones result in excessive blood glucose levels and hepatic ketogenesis. Osmotic diuresis depletes fluid and electrolytes and increases free fatty acids, consequently eliciting severe dehydration and acidemia, sometimes resulting in fatal conditions. In DKA pathophysiology, the consequence of metabolic decompensation has been negatively associated with various endocrine functions, including thyroid [6,7] and growth hormone [8] functions. Although Hu et al. [9] recently reported that patients with DKA and euthyroid sick syndrome were shown to have poor glycemic control during the initial days of treatment, the long-term prognosis related to endocrinologic derangement in DKA patients has not yet been well documented.
Most DKA patients fully recover without major complications if appropriate insulin, fluid, and electrolytes are provided. However, deleterious effects of DKA have been observed depending on the severity of the disease or risk factors like a younger age, new-onset diabetes, and greater duration of symptoms. Cameron et al. reported that DKA at T1DM diagnosis results in morphologic and functional brain changes, which are detrimental to neurocognition [10]. Moderate to severe DKA at the onset of T1DM was also found to be detrimental to residual β-cell function, which was accompanied by poor long-term metabolic regulation [11,12]. Moreover, DKA at diagnosis has been suggested to be a poor prognostic factor for long-term glycemic control, regardless of demographic and socioeconomic factors [11,13]. Despite reports indicating the clinical significance of DKA at initial diagnosis, a limited number of studies have been conducted in South Korea with epidemiologic and geographic data, and none have assessed the prognosis or clinical outcomes of DKA during the follow-up period [3,14,15].
In this study, we aimed to investigate the clinical and biochemical differences in newly diagnosed T1DM patients with or without DKA at presentation. As differential severity at initial presentation possibly results in a differential clinical course, we analyzed possible diabetic complications (e.g., dyslipidemia, disturbed thyroid function, poor height growth, etc.) between DKA and non-DKA groups. In addition, we compared glycated hemoglobin (HbA1c) levels, residual islet functions, and insulin demands between DKA and non-DKA patients at initial diagnosis, as these factors have previously been reported to be major clinical consequences of initial DKA at T1DM diagnosis.
Materials and methods
1. Subjects
All subjects had a definitive clinical diagnosis of T1DM and a duration of observation >6 months during the observation period from January 2008 to August 2020 at Ajou University Hospital. Diabetes classification was based on clinical features, including obesity, ketosis, autoimmunity, acanthosis nigricans, and subsequent disease courses. Patients with type 2 diabetes mellitus (T2DM) and monogenic diabetes were excluded based on clinical presentation as well as genetic confirmation. The diagnosis of DKA followed the biochemical criteria of the 2018 International Society for Pediatric Adolescent Diabetes Clinical Practice and Consensus guidelines, which include hyperglycemia (blood glucose >200 mg/dL), venous pH <7.3 or serum bicarbonate <16 mEq/L, and ketonemia (≥3 mmol/L) or moderate or high ketonuria. DKA was further categorized as severe (pH <7.15 or serum bicarbonate <10 mEq/L) or mild-to-moderate (pH <7.10–7.29 or 10≤ serum bicarbonate <15). This study was approved by the Institutional Review Board of Ajou University Hospital.
2. Methods
Clinical data were collected retrospectively from medical records. Height was measured using a Harpenden stadiometer (Holtain, Crosswell, Crymych, UK), and weight was recorded with a digital scale at Ajou University Hospital. Serum levels of glucose, sodium, total cholesterol, triglycerides, high-densitylipoprotein cholesterol (HDL-c), low-density lipoprotein cholesterol (LDL-c), and venous blood gas were measured using a TBA200-FR automatic analyzer (Toshiba, Tokyo, Japan). HbA1c levels were measured with the use of the COBAS Integra 800 turbidimetric inhibition immunoassay (Roche, Basel, Switzerland). Serum insulin-like growth factor 1 (IGF-1) and insulin-like growth factor binding protein 3 (IGF-BP3) levels were measured using the NEXT IRMA CT BC 1110 immunoradiometric assay (Biocode Hycel, Pouilly En Auxois, France). Urine microalbumin, urine/serum C-peptide, serum free T4 and T3, and thyroid-stimulating hormone (TSH) concentrations were measured by radioimmunoassay (Auto RIA/SR300; Startec Biomedical AG, Birkenfeld, Germany). IGF-1 standard deviation scores for age and sex were calculated according to Korean IGF-1 levels for healthy children and adolescents of the same age and sex [16]. The reference ranges for the thyroid function test were as follows: free T4, 0.64–1.72 ng/dL; T3, 81–197 ng/dL; and TSH, 0.15–5.00 mIU/L. All eligible patients underwent blood chemistry analysis, and urine microproteinuria tests annually, and HbA1c test at least every 6months in Ajou University Hospital.
3. Statistical analysis
Student t-test was used to compare the mean values of the demographic and biochemical characteristics of non-DKA and DKA patients. Chi-squared tests and Fisher exact tests were used to compare categorical variables of clinical characteristics between the non-DKA and DKA groups. For expected cell frequencies of >5, the chi-square test was used, and Fisher exact test was used for frequencies of <5. The comparison of insulin dose at discharge in all groups was analyzed by 1-way analysis of variance with Bonferroni test for multiple comparisons. A linear mixed-model was used to estimate the mean changes in insulin demand and HbA1c level to account for the inherent correlation of repeated measures in the same person over time according to DKA at diagnosis. The first model was an unadjusted analysis, in which fixed effects included time, DKA at diagnosis, and interaction of DKA status by time. Second, an adjusted analysis linear mixed-model was used to estimate the mean changes in insulin demand and HbA1c level over time by DKA status, adjusting for sex, age at diagnosis, z-score of body mass index (BMI), and insulin pump use. Regarding the time variable, the time squares and time cubes were also analyzed in the same manner. All statistical analyses were performed using IBM SPSS Statistics ver. 23.0 (IBM Co., Armonk, NY, USA).
Results
1. Demographic and clinical characteristics of patients with DKA presentation at initial diagnosis of T1DM
The demographics of the 129 patients who were diagnosed with T1DM between January 2008 and August 2020 are shown in Table 1. The mean age at diagnosis of T1DM was 9.58±4.44 years, and the male vs. female ratio was 49.6% vs. 50.4%. DKA seemed to be more frequent in men, but the difference according to sex was not statistically significant. Other demographics such as age at diagnosis; z-score of height, weight, or BMI; and blood pressure were not different between DKA and non-DKA patients. Among the DKA patients, 23 patients (17.8%) and 29 patients (22.5%) had mild-to-moderate DKA and severe DKA, respectively. Regarding the clinical presentation, gastrointestinal symptoms were more frequently observed in the DKA patients. Respiratory distress and impaired consciousness were also more likely to occur in DKA patients. Otherwise, a family history of T1DM, T2DM, or pre-existing maternal gestational diabetes was not associated with DKA presentation at T1DM diagnosis. Regimens for insulin administration in this study were basically basal long-acting insulin with intermittent rapid-acting insulin; there was no difference in insulin administration methods or blood glucose monitoring between DKA and non-DKA children. Other types of medical support, such as clinic visits or counseling for diet, were provided in the same fashion regardless of DKA status.

Demographic and clinical characteristics of patients
2. Laboratory and biochemical characteristics of patients with DKA at the time of T1DM diagnosis
Regardless of the presence of DKA, both groups showed similar levels of HbA1c, with mean HbA1c levels of 12.50% and 12.54% in non-DKA and DKA patients, respectively. However, there were some differences in biochemical characteristics, such as serum and urinary C-peptides, serum glucose levels, lipid profiles, thyroid function, and insulin-like growth factors between DKA and non-DKA patients. The initial serum glucose level, urine microalbumin excretion, and serum uric acid level were higher but serum C-peptide and 24-hour urine C-peptide levels were lower in DKA patients than non-DKA patients, respectively. Serum lipid profile levels were worse in DKA patients in whom higher total cholesterol, triglycerides, and LDL-c were observed. Although all values of thyroid function testing were within the reference ranges, fT4, T3, and TSH levels were lower in the DKA group than the non-DKA group. In particular, the T3 level of DKA patients was at the lower limit of the normal range. The z-scores for serum IGF-1 and BP3 levels were also robustly lower in the DKA group.
3. Comparisons of clinical outcomes between patients with and without DKA at initial diagnosis of T1DM
1) Effects of DKA at initial diagnosis of T1DM on insulin dosage during the follow-up period
The comparison of major clinical outcomes of DKA and non-DKA patients was conducted according to insulin dosage during the 5-year follow-up period. The DKA group required a significantly higher insulin dose than the non-DKA group at the time of discharge, a need which persisted for 2 years after diagnosis; specifically, the mean insulin dosages were 1.01 units/kg/day, 0.79 units/kg/day, and 0.94 units/kg/day for DKA patients and 0.82 units/kg/day, 0.65 units/kg/day, and 0.77 units/kg/day for non-DKA patients at baseline, 1 year, and 2 years after diagnosis, respectively (Fig. 1). Although the post hoc test result was statistically significant during 2 years of follow-up, the overall effect of DKA at initial diagnosis was confirmed with linear mixed models, in which there was no difference in the effect of DKA over time. The time variable was also converted to the time squares and time cubes and analyzed in linear mixed models in the same manner; however, the differential effects of DKA over time squares and time cubes were not found (Table 2).
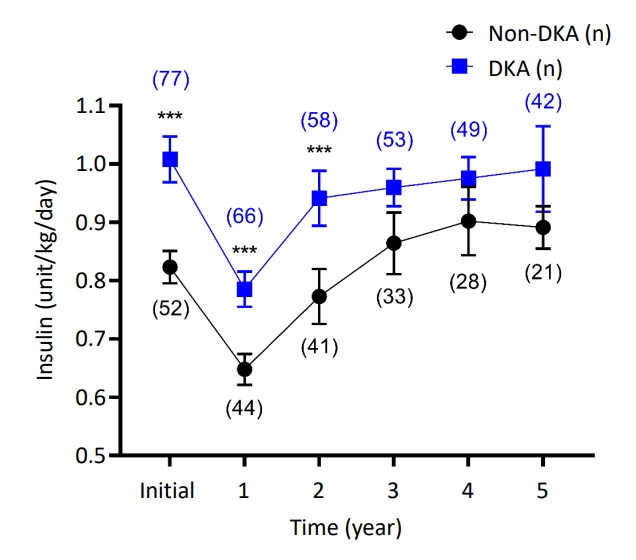
Effect of diabetic ketoacidosis (DKA) at initial diagnosis on insulin demand and residual β-cell functions. Insulin demands were calculated as units/kg/day. Comparisons of insulin dosages at each time point were analyzed by post hoc tests with Bonferroni method. Data are expressed with mean±standard error values. ***P<0.001 (number of observed patients).
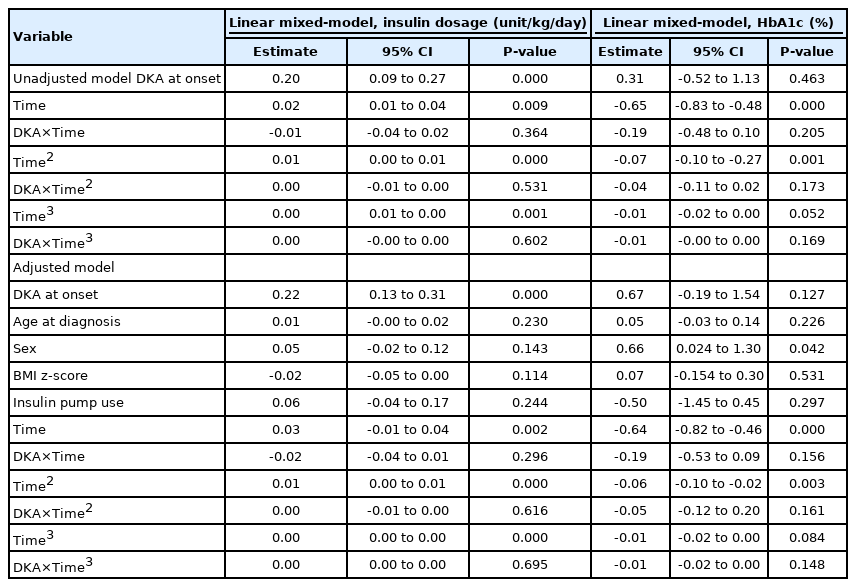
Summary of the linear mixed-model analysis for repeated-measurement with DKA as the independent variable and insulin dose and HbA1c during follow-up as the outcome variables
2) Effects of initial DKA at initial diagnosis of T1DM on long-term glycemic control and other biochemical profiles
DKA patients and non-DKA patients had similar HbA1c concentrations during the 5-year follow-up period (Fig. 2A). In addition, there was no differential long-term effect of DKA on HbA1c level over time in the analysis with the linear mixed models (Table 2).
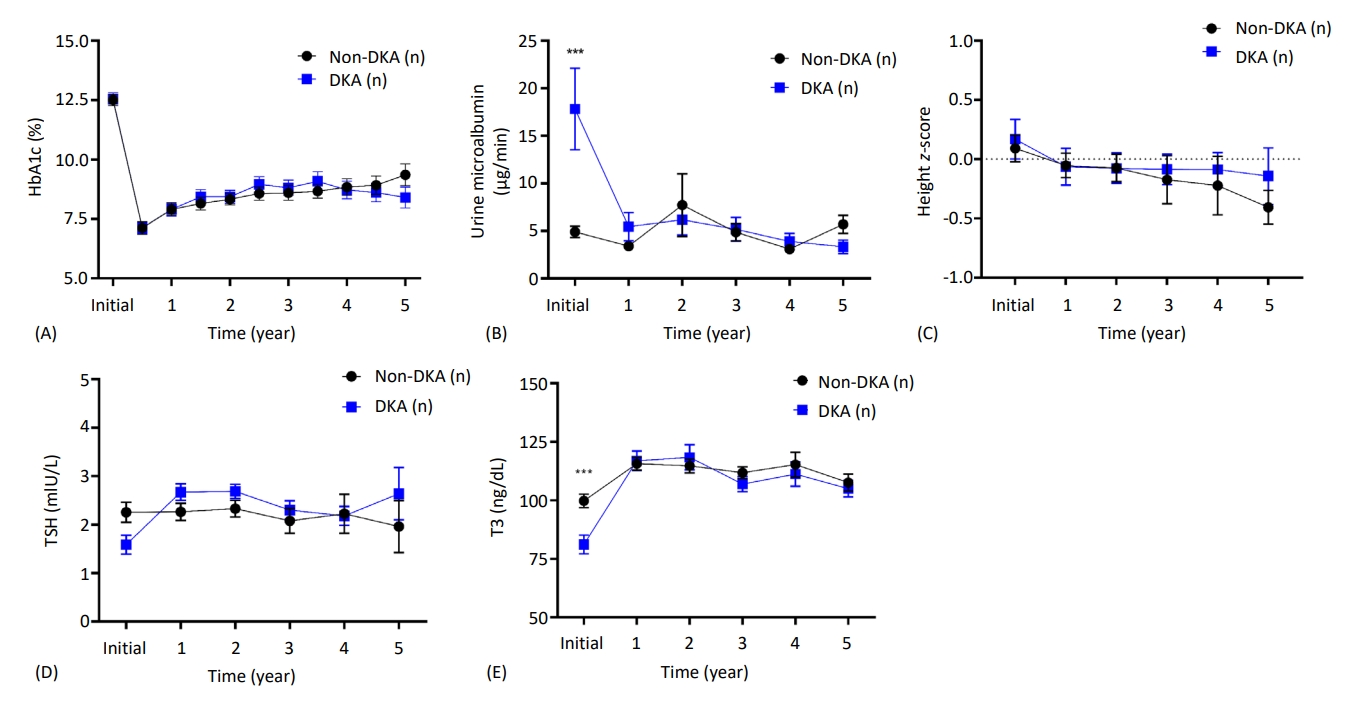
Comparison of long-term clinical outcomes between the diabetic ketoacidosis (DKA) and non-DKA groups. (A) The serial glycated hemoglobin (HbA1c) levels were measured and analyzed every 6 months during the 5-year follow-up period. (B) Serial measurements of 24-hour urine microalbumin excretion were compared between DKA and non-DKA patients during a follow-up period of 5 years at 1-year intervals. (C) Change in height z-score from baseline to 5 years after the initiation of insulin treatment. Patients aged <1 year or >12 years were excluded from the comparison to facilitate the precise analysis of growth. Changes in serum TSH (D), T3 (E), and free T4 (F) levels in patients with type 1 diabetes mellitus were compared between the DKA and non-DKA groups. Comparisons of initial differences were analyzed by post hoc tests with Bonferroni method. Data are expressed with mean±standard error values. ***P<0.001.
Although microalbuminuria was temporarily observed in patients with DKA at initial diagnosis of T1DM, these patients regressed to a state of normoalbuminuria with insulin treatment and maintained a level similar to that of non-DKA patients during the follow-up period (Fig. 2B). Similarly, differences in T3, free T4, and TSH levels between non-DKA and DKA patients were present at diagnosis but disappeared with insulin treatment (Fig. 2D–F). With regard to the height growth in the differential groups (DKA vs. non-DKA), the initial height z-scores and height z-scores over 5 years were not different between the non-DKA and DKA groups (Fig. 2C). A summary of initial biochemical characteristics is presented in Table 3.
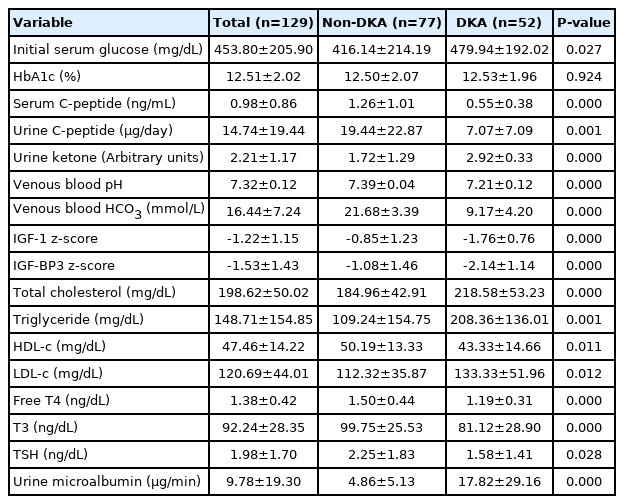
Biochemical characteristics of non-DKA and DKA patients
Discussion
DKA has been suggested to be a poor prognostic factor for glycemic control, as it exacerbates the depletion of pancreatic islet cells [17], worsens residual β-cell function [18], and increases insulin requirements [19] in the early phase of T1DM progression. With regard to the long-term prognosis, a recent long-term prospective cohort study also reported that DKA at initial diagnosis could predict poor glycemic control [20]. However, there is little evidence that can be adapted to a variety of populations, including Asian patients, because previous studies were conducted in limited areas (i.e., mostly Western countries) with poor representation of different populations. Hence, in this study, we analyzed newly diagnosed T1DM patients with DKA and observed negative effects on clinical outcomes in a similar manner but in a different population. Specifically, we found that insulin demands were significantly higher in DKA patients than non-DKA patients for the first 2 years of follow-up after diagnosis in a South Korean population. These findings together support the notion that DKA at initial T1DM diagnosis exacerbates metabolic decompensation and decreases residual β-cell function [17,18], which could result in higher insulin requirements in the long term, eventually adversely influencing glycemic control and increasing the economic burden.
We did not find any effect of DKA at diagnosis on the glycemic control of T1DM patients. According to our data, a difference in glycemic control between DKA and non-DKA patients was not observed during the 5-year follow-up period; even at 3 months after T1DM diagnosis, HbA1c (%) did not vary significantly between the groups (data not shown). These findings conflict with those of a previous study by Duca et al. [20] where DKA as an initial presentation of T1DM was associated with a poor prognosis of glycemic control. One interesting difference between our study and that by Duca et al. [20] was initial HbA1c levels: in our investigation, initial HbA1c levels were relatively higher in both the DKA and non-DKA groups (12.50%±2.07% for non-DKA and 12.53%±1.96% for DKA) than in the study by Duca et al. [20] (9.9%±1.5% for DKA and 8.5%±1.4% for non-DKA). These discrepancies imply that the effects of DKA on long-term prognosis are not only possibly due to ethnical differences but also different physiological conditions at the time of initial T1DM diagnosis. In fact, a recent report suggested that the co-occurrence of various medical conditions with DKA, such as lactic acidosis, also result in worse clinical outcomes [21]. Although we speculated in this study that high HbA1c levels might suggest deleterious metabolic conditions to the residual islet cell function, their exact effects were not evaluated, especially in various ethnicities. Therefore, further studies will be needed to discern whether differential physiological conditions at diagnosis or ethnicity differentially affect the long-term prognosis.
Approximately 40% of newly diagnosed T1DM patients had DKA in our study, similar to the findings of other recent reports [3,4]. DKA patients more frequently presented with gastrointestinal symptoms such as hyporexia, abdominal pain, and nausea/vomiting; respiratory distress; and impaired consciousness. In addition, higher levels of serum glucose, total cholesterol, and LDL-c but lower levels of serum C-peptide, 24-hour urine C-peptide, and HDL-c were observed in patients with DKA compared to non-DKA patients. All symptoms are likely involved in the compensatory mechanisms of acid-base imbalance and/or the decompensation of metabolic crisis. On the other hand, compromised lipid profiles seemed to be associated with lipolysis of DKA. Together, these results suggested that DKA patients had more severe insulinopenia, which was also supported by decreased serum and urine C-peptides.
One of the interesting findings in our study was the endocrinological effect of DKA on T1DM patients. We found significantly low T3, free T4, and TSH levels in DKA patients, who also presented lower z-scores of serum IGF-1 and IGF-BP3 levels than non-DKA patients. Despite their low IGF-1 and IGF-BP3 levels at diagnosis, a difference in the z-score of height between DKA and non-DKA patients was not found (Fig. 2C). Possible mechanisms for the change in IGF-1/BP3 in T1DM have been suggested to include a reduction in hepatic growth hormone receptor or binding proteins in acute insulin deficiency, in which the decrease in IGF-1/BP3 was dependent on the severity of insulin deficiency [8]. It was also reported that IGF-1/BP-3 level may reflect improvements in metabolic control regardless of changes in growth hormone level [22,23]. Consistent with these previous reports, our present data showing an initial decrease in IGF-1/BP3 in patients with DKA may support the notion that IGF-1/BP3 reflects the severity of insulin deficiency, and the trend in the following data may also predict long-term glycemic control and prognosis. Future studies in larger cohorts will be needed to clarify the role these factors play in this matter.
The main limitation of this study is the conduct of a retrospective analysis based on data from a single center. Some records contained incomplete data regarding follow-up time or duration, which resulted in a large standard error of the mean in the linear mixed-model analysis. For instance, insulin demands seemed to be higher in DKA patients at all time points, but statistical significance was observed only in the first 2 years of follow-up. Future studies with a larger number of patients will be expected to resolve the limitations of incomplete data. Second, we postulated residual β-cell function with increasing administered insulin dosage; however, this parameter provided an indirect measurement of insulin secretion. Therefore, serial C-peptide measurements should be more appropriate for assessing the exact residual function of β-cells. Third, we did not adjust the analysis for the administration of different insulin analogs or the recurrence of DKA. Although recent advances in new insulin analogs and beneficial effects have been reported, we did not reflect their possible differential effects. In addition, the recurrence of DKA and its deleterious effect on residual insulin functions were not analyzed. In future studies, an analysis of the recurrence of DKA and residual β-cell function would also be helpful for better understanding the deleterious effects of DKA.
In summary, our analyses of serum blood glucose, lipid profile, serum/urine C-peptide, and endocrinological parameters including a thyroid function test and IGF-1/BP3 levels together supported that patients with DKA at diagnosis can be considered to have more severe insulin deficiency than those without DKA. Although the effect of DKA at diagnosis on the long-term prognosis or glycemic control was not made clear in our investigation, the negative effects of DKA on insulin demands or β-cell function were significant, which cannot be ignored in terms of clinical outcome. DKA, which can be life-threatening, is a major acute complication requiring early diagnosis and treatment, and it is associated with high socioeconomic costs in patients with T1DM. Therefore, the occurrence of DKA in children with T1DM should be closely examined, and these individuals should be supported with appropriate care to prevent recurrence.
Ethical statement
This study was approved by the Institutional Review Board of Ajou University Hospital (AJIRB-MED-MDB-20-594), which waived the requirement for written informed consent due to the retrospective study design.
Notes
Conflicts of interest
No potential conflict of interest relevant to this article was reported.
Funding
This study received no specific grant from any funding agency in the public, commercial, or not-for-profit sectors.
Data availability
The data that support the findings of this study are available from Harvard Dataverse: https://doi.org/10.7910/DVN/JTME1F.
Author contribution
Conceptualization: JSH; Data curation: YS, CDK, JGR, YSS, HSL; Formal analysis: YS, CDK, JGR, YSS, HSL; Project administration: JSH; Visualization: YS; Writing - original draft: YS; Writing - review & editing: YS, YSS, HSL