Demographic and diagnostic markers in new onset pediatric type 1 and type 2 diabetes: differences and overlaps
Article information

Abstract
Purpose
Type 1 diabetes (T1D) is the most common type of diabetes in children, but the frequency of type 2 diabetes (T2D) is increasing rapidly. Classification of diabetes is based on a constellation of features that vary by type. We aimed to compare demographic, clinical, and laboratory characteristics at diagnosis of pediatric T1D and T2D.
Methods
We studied children who visited a large academic hospital in Houston, Texas (USA) with a new diagnosis of T2D (n=753) or T1D (n=758). We compared age, sex, race/ethnicity, presence of obesity, glucose, hemoglobin A1c, islet autoantibody positivity, C-peptide, and presence of diabetic ketoacidosis (DKA) at diabetes diagnosis.
Results
At diagnosis, children with T2D, compared with those with T1D, were older (13.6 years vs. 9.7 years), more likely female (63.2% vs. 47.8%), of racial/ethnic minority (91.1% vs. 42.3%), and obese (90.9% vs. 19.4%) and were less likely to have DKA (7.8% vs. 35.0%) and diabetes autoantibodies (5.5% vs. 95.4%). Children with T2D also had significantly lower glucose, lower hemoglobin A1c and lower C-peptide level (all comparisons, P<0.0001). In multiple logistic regression analysis, older age, racial/ethnic minority, obesity, higher C-peptide, and negative islet autoantibodies were independently associated with T2D (all, P<0.05), while sex, glucose, hemoglobin A1c, and DKA were not (model P<0.0001).
Conclusions
There are important demographic, clinical, and laboratory differences between T1D and T2D in children. However, none of the characteristics were unique to either diabetes type, which poses challenges to diabetes classification at diagnosis.
Highlights
· We studed children with new onset type 1 diabetes (T1D, n=758) or type 2 diabetes (T2D, n=753). Although many characteristics were statistically different between T1D and T2D, none of them was unique to either diabetes type, which poses challenges to diabetes classification at diagnosis.
Introduction
Diabetes is the second most common chronic disease of childhood, after asthma. It occurs in 1 of 300 children in the United States, and its frequency is increasing, particularly among non-White racial groups [1]. Most cases of pediatric diabetes are type 1 diabetes (T1D) [2], characterized by a lack of endogenous insulin that, in most cases, is due to autoimmunity against beta-cells in pancreatic islets. The appearance of islet autoantibodies in serum is a marker of the autoimmune process [3,4]. In contrast, in T2D, there is endogenous insulin secretion that is not sufficient to meet the demands, which are frequently increased (insulin resistance) [3,4]. Insulin resistance is most often caused by obesity but is also promoted by puberty, pregnancy, aging, and certain drugs. The "obesity epidemic" has caused an increase in T2D, which is now diagnosed in more than 10% of children with diabetes [5].
Classification of diabetes type is currently based on the presence of a constellation of features that vary by diabetes type [3,4]. Of note, these characteristics were defined based on studies conducted in primarily non-Hispanic White populations and might not be generalizable to other racial or ethnic groups. In addition, T2D is a relatively new cause of diabetes in children. Overall, timely and accurate identification of diabetes type is often challenging [6,7]. Therefore, we aimed to compare the characteristics at diabetes diagnosis of racially/ethnically diverse children with T1D or T2D.
Materials and methods
This is a secondary analysis of deidentified data from chart reviews of children newly diagnosed with T1D (n=758) between 2008 and 2010 [8] or T2D (n=753) between 2016 and 2019 [9] at a large academic hospital in Houston, Texas. Diabetes type was clinically assigned by their pediatric endocrinologist. These studies were approved by the Baylor College of Medicine Institutional Review Board.
We analyzed age, sex, race/ethnicity, presence of obesity, glucose, hemoglobin A1c, random C-peptide (a measure of endogenous insulin secretion [10]), presence of diabetic ketoacidosis (DKA), and positivity for islet autoantibodies (to insulin, GAD65, or IA-2/ICA512). All the variables analyzed were measured at diagnosis of diabetes. To describe each of the cohorts, we used proportions for categorial variables and mean and standard deviation for continuous variables. To compare characteristics, we used chi-square for categorial variables and t-tests for continuous variables. Multiple logistic regression analysis was used to examine the associations between variables and type 2 diabetes after adjustment for potential confounders. To dichotomize continuous variables in children with new onset type 1 or type 2 diabetes, we used a biostatistically-based rationale in that the cut-offs were set as the mean value of the distribution for each variable in the combined cohort, rounded to the closest whole number. All analyses were performed using Stata 12 (StataCorp LLC, College Station, TX, USA). Statistical significance was noted if 2-sided P-values were <0.05.
Results
Children with T2D, compared with those with T1D, were significantly older (13.6 years vs. 9.7 years) (P<0.0001) (Table 1). Diagnosis at 12 years of age or older occurred in 74.8% of the children with T2D compared with 31.3% of those with T1D (P<0.0001). T2D was significantly associated with female sex (63.2% vs. 47.8%, P<0.0001), minority race/ethnicity (91.1%% vs. 42.3%, P<0.0001), and obesity (90.9% vs. 19.4%, P<0.0001). Children with T2D had significantly lower glucose (247.7 mg/dL) than those with T1D (402.9 mg/dL, P<0.0001); glucose was less than 300 mg/dL in 75.5% of the children with T2D and in 32.8% of those with T1D (P<0.0001). Hemoglobin A1c was also lower in T2D (9.6%) than T1D (11.7%, P<0.0001); values less than 11% were found in 67.6% of children with T2D and in 35.5% of those with T1D (P<0.0001). C-peptide was higher in T2D (4.0 ng/mL) than T1D (0.65 ng/mL, P<0.0001); values of 2 ng/mL or higher were found in 71.6% of the children with T2D and 4.6% of those with T1D (P<0.0001). DKA was significantly less frequent in T2D (7.8%) than in T1D (35.0%, P<0.0001). Most (95.4%) children with T2D but only 5.5% of those with T1D were negative for islet autoantibodies (P<0.0001). None of the characteristics were exclusive to either T1D or T2D, and there was appreciable overlap between the 2 types, as illustrated in Fig. 1 for the continuous variables (i.e., age, glucose, hemoglobin A1c, and C-peptide) and in Fig. 2 for all the characteristics under study.
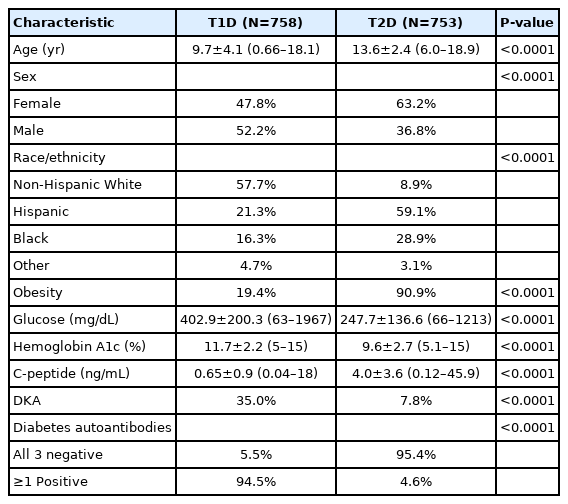
Comparison of characteristics at diagnosis of T2D and T1D in children
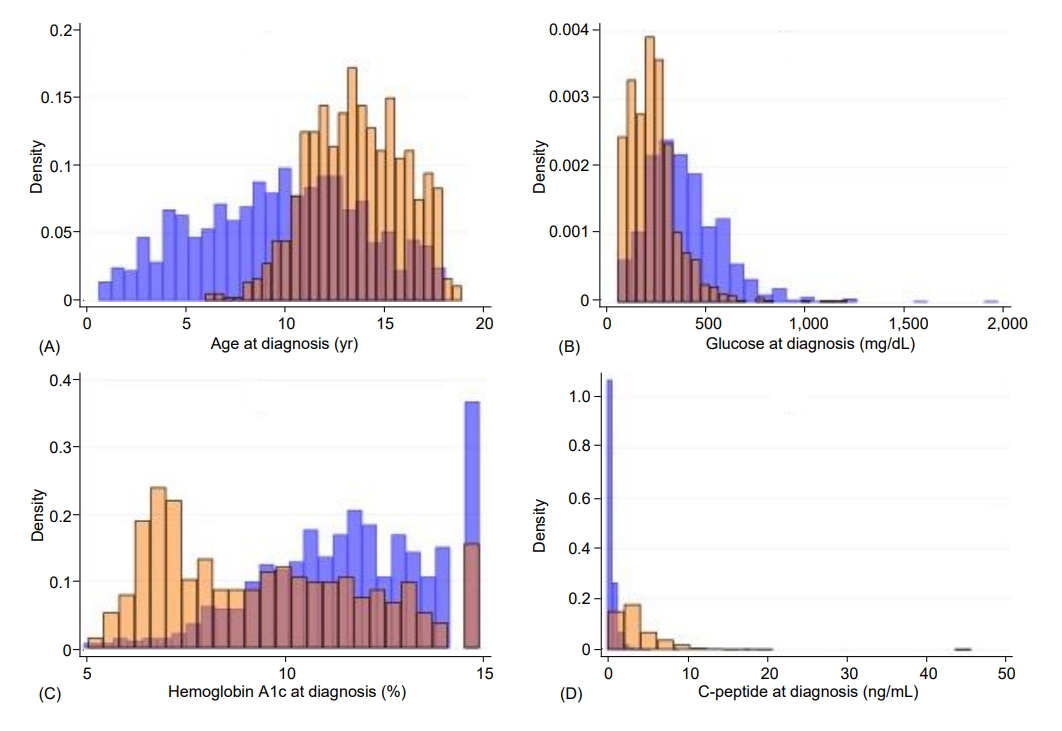
Histograms illustrating the distributions of age (A), glucose (B), hemoglobin A1c (C), and C-peptide (D) at diagnosis, by diabetes type. The ranges for age were 0.66–18.1 years for T1D and 6.0–18.9 years for T2D; for glucose, 63–1967 mg/dL for T1D and 66–1,213 mg/dL for T2D; for hemoglobin A1c, 5%–15% for T1D and 5.1%–15% for T2D; and for C-peptide, 0.04–18 ng/mL for T1D and 0.12–45.9 ng/mL for T2D. In each of the graphs, T1D is shown in blue and T2D is shown in orange. T1D, type 1 diabetes; T2D, type 2 diabetes.
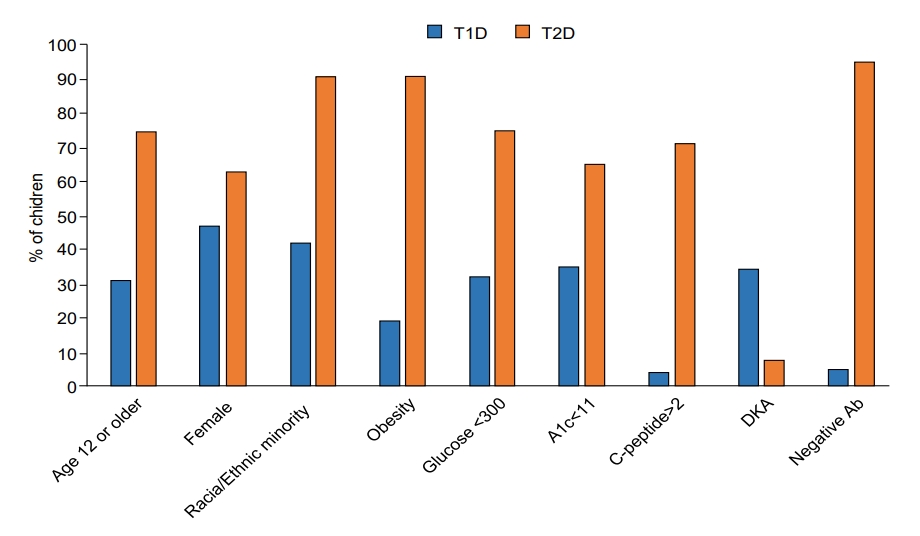
Comparison of characteristics in children with T1D and T2D at diagnosis (all, P<0.0001). Continuous variables were dichotomized using the mean value of the distribution in the combined cohort, rounded to the closest whole number. T1D is shown in blue and T2D is shown in orange. T1D, type 1 diabetes; T2D, type 2 diabetes; A1c, hemoglobin A1c; DKA, diabetic ketoacidosis; Ab, Islet autoantibodies.
In multivariable logistic analysis (P<0.0001, n=1,020), T2D was significantly associated with older age (P=0.024), race/ethnicity (Hispanic ethnicity and African American race vs. non-Hispanic White, respectively, P=0.003 and P=0.032), obesity (P<0.0001), higher C-peptide (P<0.0001) and negative islet autoantibodies (P<0.0001) but not with DKA (P=0.060), hemoglobin A1c (P=0.164), sex (P=0.253), or glucose (P=0.149) (Table 2).
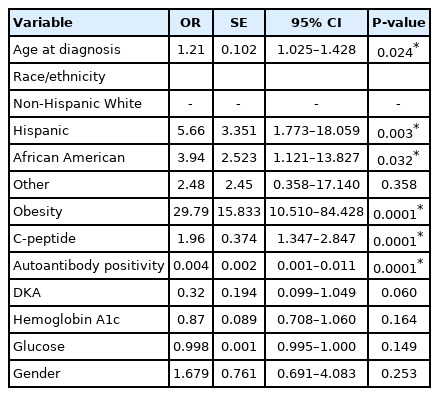
Multiple logistic regression analysis of T2D in children (n=1,023; P <0.0001)
Discussion
We studied 758 children with T1D and 753 children with T2D at the time of diabetes diagnosis. Children with T2D were older and more likely to be of racial/ethnic minority and obese, less likely to have positive islet autoantibodies, and had higher C-peptide than children with T1D. These typical characteristics for T1D or T2D are currently used to classify diabetes type at onset [3,4].
However, we observed overlap in most of these characteristics. Although the mean age at diagnosis of T1D was significantly lower than in T2D, there was marked overlap in ranges (Table 1). T2D was diagnosed at age 12 or older in 74.8% of the children with T2D, but 25.2% were younger. A recent study has reported children diagnosed with T2D younger than age 10, although it is very uncommon [9].
Racial and ethnic distributions were different between T1D and T2D, and racial/ethnic minority was significantly associated with T2D, consistent with previously published reports [7]. However, almost 9% of the children with T2D were non-Hispanic White and as much as 42.3% with T1D were of racial/ethnic minority. Likewise, although obesity was significantly associated with T2D, it was absent in 9.1% of the children with T2D and was present in almost 20% of children with T1D. Therefore, racial/ethnic minority or obesity do not absolutely exclude T1D and are not necessary for a diagnosis of T2D.
Glucose and hemoglobin A1c were lower in T2D than in T1D, but there was marked overlap in the range at diagnosis. These characteristics were not significantly associated with diabetes type in the multivariable analysis. In sum, glucose and hemoglobin A1c alone cannot be used to differentiate diabetes type.
C-peptide was higher in the children with T2D than in those with T1D, and the difference remained after adjustment for potential confounders. However, there was overlap between the ranges in the 2 groups (0.12–45.9 ng/mL in T2D and 0.04–18 ng/mL in T1D). C-peptide of 2 ng/mL or greater was found in most (71.6%) but not all of the children with T2D and also in 4.6% of those with T1D. Therefore, C-peptide has limitations as a criterion for diabetes classification.
DKA is less common than in the past but still seen in 30%– 40% children with T1D at presentation [11]. In our study, 35.0% of the children with T1D had DKA at diagnosis. Although much less common, we observed it in 7.8% of the children with T2D, which is consistent with recent data [12]. With adjustment for the characteristics in the multivariable regression model (Table 2), DKA was not significantly associated with diabetes type. Based on these findings, DKA cannot be used to classify diabetes.
Islet autoantibodies were present in the vast majority (95.4%) of the children with T1D but also in 5.5% of the children with T2D. Potential reasons for the absence of autoantibodies in individuals with otherwise undistinguishable T1D could be expression of autoantibodies that are not currently measured [13] or unrecognized forms of diabetes [14]. Positivity for islet autoantibodies in a small percentage of children with clinically diagnosed T2D has been previously reported, although its significance is unclear [8,15]. These findings limit the use of islet autoantibody positivity to discriminate between diabetes types.
Limitations of the study include the difference in time when the cohorts were collected and the lack of follow-up data. Future studies will include longitudinal follow-up of children with T1D or T2D enrolled simultaneously. In addition, the generalizability of the study might be limited by characteristics unique to our study setting, such as elevated prevalence of pediatric T2D; however, a recent report suggests similar national trends, with a steep increase in the prevalence per 1,000 youths for T2D (from 0.46 [95% confidence interval, 0.43–0.49] in 2009 to 0.67 [95% confidence interval, 0.63–0.7] in 2017) and, to a lesser degree, in T1D (from 1.93 [95% confidence interval, 1.88–1.98] in 2009 to 2.15 [95% confidence interval, 2.10–2.20] in 2017) [16].
Important strengths of our study were the large sample sizes for both T1D and T2D cohorts, and extensive characterization with data that are commonly available to clinicians, reflecting a real-world setting. Finally, although there are previous recent reports comparing children with established T1D and T2D [17,18], our study focused on characteristics at diabetes onset, since that is the optimal time to establish the correct diagnosis and treatment.
In conclusion, we described demographic, clinical, and laboratory features of children with T2D that are different from those of children with T1D at diagnosis. However, the overlap in most of the typical features for each type can pose a challenge for clinicians to classify diabetes correctly and timely. Although classification of diabetes is undergoing revision by international organizations to accommodate hybrid and atypical types of diabetes [19], it will be important to find additional markers, such as genes, that can help in the distinction of diabetes type at early as possible in the course of the disease so that the correct treatment can be administered in a timely fashion.
Ethical statement
These studies were approved by the Institutional Review Board of Baylor College of Medicine (IRB No. H-27002 and H-45325).
Notes
Conflicts of interest
No potential conflict of interest relevant to this article was reported.
Funding
This study received no specific grant from any funding agency in the public, commercial, or not-for-profit sectors.
Data availability
The findings of this study can be provided by the corresponding author upon reasonable request.
Author contribution
Conceptualization: MR; Data curation: TN, MR; Formal analysis: TN, MR; Funding acquisition: MR; Methodology: TN, BC, JN, MR; Project administration: MR; Writing - original draft: TN; Writing - review & editing: TN, BC, JN, MR ORCID
Acknowledgements
The T1D cohort was collected with funds from the Texas Hospital Children Pilot Award (year 2010) (MJR). We acknowledge Dr. Marcela Astudillo, who collected the T2D cohort and provided feedback on the analyses, and Dr. Mustafa Tosur who also provided feedback on the analyses.