Metabolically healthy overweight adolescents: definition and components
Article information

Abstract
Purpose
In adolescents, the definition and clinical implications of metabolically healthy overweight (MHO) status have not been established. This study aimed to investigate the prevalence of MHO according to its most widespread definition, which is based on metabolic syndrome (MS), and to explore further metabolic indicators such as Homeostatic Model Assessment of Insulin Resistance, total cholesterol, low-density lipoprotein cholesterol, alanine aminotransferase, and C-reactive protein levels, together with metabolic health predictors in a sample of adolescents attending a pediatric obesity clinic.
Methods
Data from 487 adolescents categorized as overweight (52.6% females, 88.1% white), with a mean body mass index (BMI) z-score of 2.74 (±1.07 standard deviation [SD]), and a mean age of 14.4 years (±2.2 SD) were cross-sectionally analyzed. From this original sample, a subsample of 176 adolescents underwent a second assessment at 12 (±6 SD) months for longitudinal analysis.
Results
From the 487 adolescents originally analyzed, 200 (41.1%) were categorized as MHO, but only 93 (19.1%) had none of the metabolic indicators considered in this study. According to longitudinal analysis, 30 of the 68 adolescents (44%) categorized as MHO at baseline became non-MHO over time. BMI z-score was the best predictor of metabolic health both in cross-sectional and longitudinal analyses. Increased BMI z-score reduced the odds of being categorized as MHO (odds ratio [OR], 0.6; 95% confidence interval [CI], 0.4–0.9; P=.008) and increased the odds of having hypertension (OR 2.1, 95% CI: 1.4–3.3, P=0.001), insulin resistance (OR, 2.4; 95% CI, 1.4–4.1, P=0.001), or a proinflammatory state (OR, 1.2; 95% CI, 1.1–1.3, P=0.002).
Conclusions
Diagnosis of MHO should not be exclusively based on MS parameters, and other metabolic indicators should be considered. Adolescents categorized as overweight should participate in weight-management lifestyle interventions regardless of their metabolic health phenotype.
Introduction
Between 2002 and 2014, the prevalence of obesity in adolescents increased in Europe [1]. Overweight, including obesity, is associated with several cardiovascular and metabolic conditions [2], as well as premature death and all-cause mortality later in life [3], producing a serious public health concern.
Recent literature suggests the existence of a subgroup of overweight individuals with an evidently metabolically healthy phenotype and a low risk of cardiovascular disease [4]. Depending on the definition of metabolic health, the prevalence of metabolically healthy overweight/obesity (MHO) ranges from 6% to 40% in the adult population [4-7] and from 7% to 80% in adolescents [8,9].
Metabolic health in overweight youth is believed to be influenced by physical activity level and intensity, time spent in sedentary behaviors, cardiorespiratory fitness, body composition, fat distribution, and/or duration of overweight [8,10,11]. Because of the complexity of interactions among factors associated with metabolic health, it is not agreed upon whether MHO adolescents may be considered truly metabolically healthy or whether they are just at a lower risk of cardiovascular disease.
In this regard, one of the most debated issues is the definition of MHO. The most widespread definition of MHO rely on the absence of metabolic syndrome (MS). However, the accuracy of this is in question because there are relevant metabolic indicators not included in characterization of MS (e.g., total cholesterol [TC], low-density lipoprotein cholesterol [LDL-C], Homeostatic Model Assessment of Insulin Resistance [HOMA-IR], alanine aminotransferase [ALT], and C-reactive protein (CRP) levels) [13-18].
Another commonly debated issue is the implications of MHO status for clinical practice. To date, it is unclear whether MHO adolescents would benefit from weight-management lifestyle interventions with a focus on dietary and physical activity as MHO adolescents may already engage in sufficient physical activity [8,10].
The current study aims to (1) determine the prevalence of MHO according to the most widespread definition in a sample of overweight adolescents attending a pediatric obesity clinic, (2) investigate the presence of abnormal metabolic indicators beyond those included in the definition of MHO, and (3) analyze cross-sectional and longitudinal associations between anthropometric/body composition measures and altered metabolic indicators.
Materials and methods
1. Participants
We searched the clinical files of adolescents categorized as overweight (BMI ≥85th percentile); between the ages of 12 and 18 years; with a first appointment at the Pediatric Obesity Clinic, Hospital de Santa Maria, Lisbon, Portugal, between October 2014 and June 2019; and with available retrospective data. Exclusion criteria included adolescents with major pathology other than obesity or related comorbidities and/or conditions leading to inability to perform regular physical activity.
In a second search, clinical files from every adolescent included in the initial sample were evaluated for complete anthropometric and clinical data.
2. Measurements
1) Anthropometric and body composition assessments
Height was assessed with a height stadiometer, with subjects standing with their backs to the stadiometer and holding their heads level with a horizontal Frankfurt plane. Subjects stood with their feet together without shoes and were measured after expiration. Height was registered to the nearest 0.1 cm (SECA 217, Hamburg, Germany).
Body weight and body composition were measured with a bioelectrical impedance scale to the nearest 0.1 kg, with the subjects wearing minimal clothing and without shoes or socks (InBody 230, Seoul, Korea). Relative body fat mass (% BFM) and skeletal muscle mass (% SMM) were calculated by dividing total BFM (kg) and SMM (kg) by body weight, respectively.
B ody mass index (BMI) was calculated by dividing body weight in kilograms by the square of height in meters [BMI=weight (kg)/height2 (m)]. BMI z-score was calculated based on World Health Organization (WHO) data [BMI z-score=[(BMI/M(t))L(t)-1]/L(t)S(t)].
Waist circumference (WC) was assessed using a flexible anthropometric tape at the level of the iliac crest, with subjects standing and at the end of regular expiration (SECA 203).
2) Clinical assessments
Pubertal status was assessed and categorized according to Tanner stage.
Resting blood pressure was measured using a digital sphygmomanometer on the right arm following 5 minutes of rest in a seated position (CAS 9302S, CAS Medical Systems, Branford, CT, USA). Measurements were performed 3 times, and the average of the 3 measurements was recorded.
Biochemical analyses were performed in a laboratory of clinical pathology at the same hospital. Blood samples were collected after overnight fasting (12 hours) in the presence of one parent/caregiver and following local application of a topical anesthesia patch (EMLA, AstraZeneca, Barcarena, Portugal). Blood glucose level was determined using the hexokinase method, and insulin was assessed using a chemiluminescence immunoassay technique. Insulin sensitivity was derived by the HOMA-IR. ALT, TC, and triglyceride (TG) and high-density lipoprotein cholesterol (HDL-C) levels were determined using enzymatic, GPO/Trinder, and direct methods, respectively. LDL-C was calculated from TC and HDL-C [19]. Level of CRP was determined using turbidimetric immunoassay (Siemens, ADVIA 2400, Newark, DE, USA).
3) Metabolically healthy overweight
In line with other studies [8], MHO was defined as the absence of cardiometabolic risk factors such as hypertension, hyperglycemia, low level of HDL-C, and hypertriglyceridemia (Supplemental Table 1). Age- and sex-specific values for the described metabolic indicators were used, with sensitivity and specificity reported elsewhere [20].
As suggested in previous research, WC was not included in the MHO definition as a large majority of overweight individuals present a WC above age- and sex-specific thresholds [8,9].
4) Presence of other overweight-related metabolic comorbidities
Based on a literature search, the following values were considered abnormal: TC ≥95th percentile [15], LDL-C≥95th percentile, insulin resistance (IR) as HOMA-IR ≥90th percentile [21,22], ALT ≥95th percentile [23], and CRP >0.30 mg/dL (Supplemental Table 2) [24].
5) Overweight duration
Onset of overweight, designated as the time at which BMI started to exceed the 85th percentile based on WHO charts, was assessed using medical records. Overweight duration was calculated as the difference in months between current age and onset of overweight.
3. Statistical analysis
This study comprises both cross-sectional and longitudinal analyses.
According to prevalence sample size calculation, a sample of 384 participants was needed to achieve a level of confidence of 95% and a precision of 5%, a expected prevalence of 50% (95% confidence interval [CI] limit, [45%, 55%]) [25]. Population was defined as the total number of adolescents followed in the clinic at the time of assessment.
Data were analyzed using IBM SPSS Statistics ver. 24.0 (IBM Co., Armonk, NY, USA). After analysis for normal distribution, baseline differences between girls and boys were analyzed using chi-square and independent sample t-tests. Cohen d formula was used to calculate effect size. Baseline differences between MHO and non-MHO adolescents were analyzed using chi-square and independent sample t-tests.
Logistic regression analysis (stepwise method) and Poisson regression analysis were performed to investigate the associations between anthropometric/body composition data and presence of MHO/abnormal cardiometabolic indicators and number of comorbidities, respectively. A P-value<0.05 was considered statistically significant.
Results
1. Cross-sectional analysis
Clinical files from 487 adolescents categorized as overweight (52.6% girls, 88.1% white), with a mean age of 14.4 years (±2.2 standard deviation [SD]) and a mean BMI z-score of 2.74 (±1.07 SD), were analyzed.
Girls presented higher age (d=0.18, P=0.032), pubertal status (P<0.001), and % BFM (d=0.64, P<0.001) compared to boys. Conversely, boys presented higher weight (d=0.18, P=0.048), height (d=0.60, P≤0.001), BMI z-score (d=0.18, P=0.050), WC (d=0.22, P=0.030), % SMM (d=0.52, P<0.001), ALT level (d=0.44, P<0.001), and maximum rate of oxygen consumption during incremental exercise (VO2max) (d=0.48, P=0.030) compared to girls (Table 1). However, because no sex differences were found in the prevalence of MHO, girls and boys were analyzed together (Table 2).
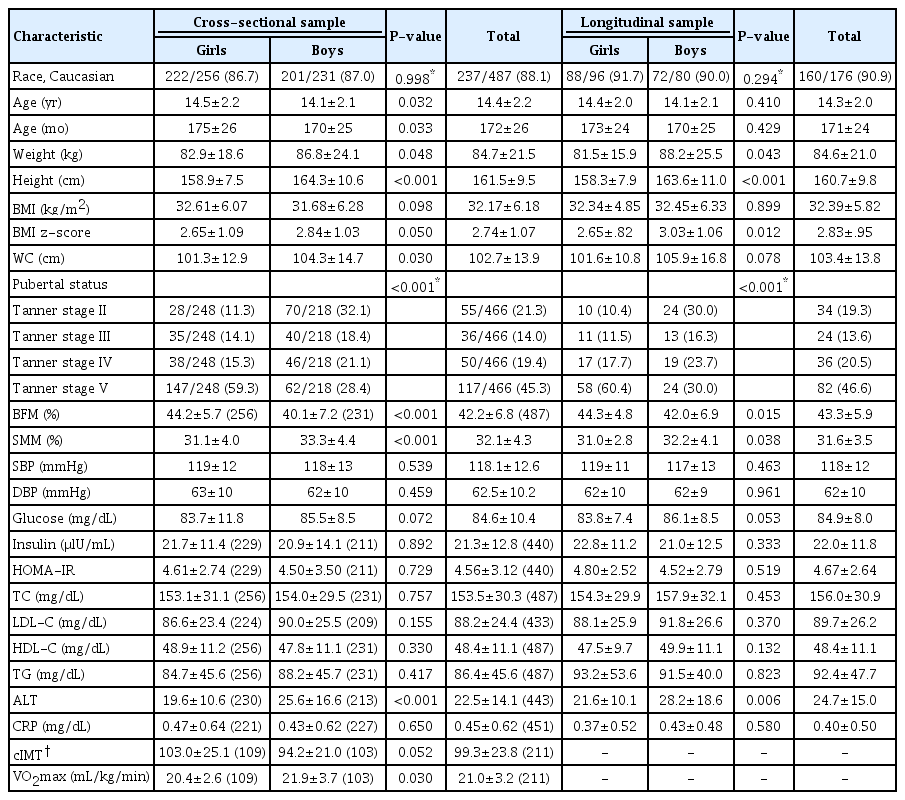
Participants' characteristics
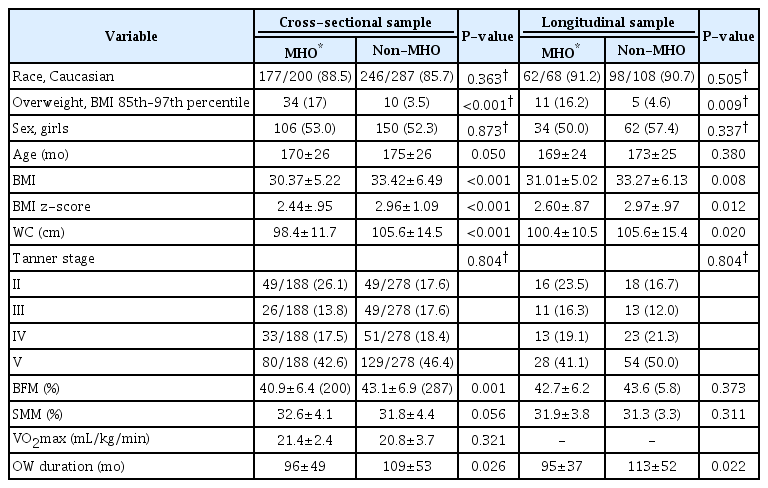
Baseline differences between metabolically healthy and nonmetabolically healthy adolescents.
High abdominal adiposity was observed in 95.7% of the total sample (93.5% of MHO adolescents and 97.2% of non-MHO adolescents, P=0.047) (Table 3).

Presence and overtime changes in altered cardiometabolic indicators
A total of 200 adolescents (41.1%) fulfilled the criteria for MHO. Adolescents categorized as MHO showed lower age (d=0.19, P=0.050), BMI (d=0.52, P<0.001), BMI z-score (d=0.51, P<0.001), WC (d=0.55, P<0.001), % BFM (d=0.33, P=0.001), and overweight duration (d=0.26, P=0.026) compared to non-MHO adolescents (Table 3).
Except for IR and altered ALT levels, which were less prevalent in MHO adolescents (36.4 vs. 54.7%, P<0.001; 24.0 vs. 32.8%, P=0.046) than in non-MHO adolescents, none of the other explored metabolic and inflammatory indicators not included in the MHO definition (i.e., TC, LDL-C, and CRP) were statistically different between MHO and non-MHO adolescents.
Ninety-three adolescents (46.5% of the MHO group and 19.1% of the total sample) had none of the metabolic indicators considered (Table 3).
According to the logistic regressions performed, BMI z-score was the only anthropometric/body composition variable associated with MHO status. Additionally, BMI z-score was associated with hypertension, IR, and inflammation. A higher BMI z-score decreased the odds of MHO (OR, 0.6; 95% CI, 0.4–0.9; P=0.008) and increased the odds of hypertension (OR, 2.1; 95% CI, 1.4–3.3; P=0.001), IR (OR, 2.4; 95% CI, 1.4–4.1; P=0.001), and proinflammatory status (OR, 1.2; 95% CI, 1.1–1.3, P=0.002). Higher WC was associated with increased odds of abnormal TC level (OR, 1.1; 95% CI, 1.0–1.2; P=0.001). According to Poisson regression analysis, WC was associated with number of comorbidities observed (F[1,486]=23.041, P<0.001) with an R2 of 0.217 (Table 4).

Prediction of altered cardiometabolic indicators.
2. Longitudinal analysis
A total of 176 adolescents (36.1% of the total sample, 90.1% white) was included in longitudinal analysis. The longitudinal sample presented a mean age of 14.3 years (±2.2 SD) and a mean BMI z-score of 2.83 (±0.95 SD). The time elapsed between assessments was 13 months (±6 SD).
At baseline, girls (54.5%) presented higher pubertal status (P<0.001) and % BFM (d=0.39, P=0.015) compared to boys. On the other hand, boys presented higher weight (d=0.32, P=0.043), height (d=0.56, P<0.001), BMI z-score (d=0.40, P=0.012), % SMM (d=0.35, P=0.038), and ALT level (d=0.40, P=0.006) (Table 1).
High abdominal adiposity was observed in 96.0% of the longitudinal sample (95.6% in the MHO group and 96.3% in the non-MHO group) at baseline (P=0.800) (Table 3).
A total of 68 adolescents (38.6%) was categorized as MHO. These adolescents showed lower BMI (d=0.41, P=0.008), BMI z-score (d=0.40, P=0.012), and WC (d=0.40, P=0.020), compared to non-MHO adolescents (Table 2). Around 44% (n=30) of the adolescents categorized as MHO at baseline became non-MHO over time. On the other hand, around 31% (n=33) of the adolescents categorized as non-MHO became MHO over time.
According to the logistic regressions performed, no associations were found among anthropometric or body composition variation and MHO status at the second assessment. However, BMI z-score variation was positively associated with hypertension, IR, and abnormal ALT level in the subsample. An increase in BMI z-score increased odds of hypertension (OR, 1.7; 95% CI, 1.0–2.7, P=0.045), IR (OR, 2.7; 95% CI, 1.4–4.1, P=0.004), and abnormal ALT level (OR, 1.9; 95% CI, 1.1–1.3, P=0.026). In addition, according to Poisson regression analysis, increased BMI z-score was associated with number of comorbidities observed at the second assessment (F[1,175]=13.009, P=0.001), with an R2 of 0.135 (Table 4).
Discussion
There is robust discussion about the existence of a metabolically healthy phenotype, associated with a lower cardiovascular risk, in overweight adolescents. Although this low-risk group may exist, the definition of MHO and its implications for clinical practice are not agreed upon by experts and practitioners.
In this study, 200 adolescents (41.1%) were categorized as MHO. This finding is inconsistent with findings of Cadenas-Sanchez et al. [8] who report an MHO prevalence of 80%, as well as findings of Heinzle et al. [9] which (based on a similar definition of MHO as herein) reports an MHO prevalence of 56.3%. This discrepancy in MHO prevalence across studies may be explained by differences in characteristics of the sample population—particularly in terms of recruitment and body weight/BMI. Reporting the lowest prevalence of MHO among the 3 studies, the findings herein may be explained by use of a clinical population (with subjects who are likely less healthier) and the higher average BMI in the current study compared to that by Cadenas-Sanchez et al. [8] (32.2±6.2 vs. 26.3±3.2).
Using a more conservative or restrictive definition of MHO (including IR and CRP levels), Heinzle et al. [9] report an MHO prevalence of 7.6%, in agreement with the present results. In looking for alternative indicators beyond those included in an MS-based definition of MHO (e.g., TC, LDL-C, IR, ALT, and CRP), only 19.1% of the total sample showed none of the established metabolic indicators.
It has been suggested that the presence of MS or MS-related indicators are key features of metabolic health [26]. As suggested in this study, however, several other metabolic indicators, which are not included in the definition of MS have an important role in clinical assessment of metabolic health in overweight adolescents [26].
Indeed, when exploring the presence of alternative metabolic and cardiovascular indicators other than those included in the MHO definition, no statistically significant differences were found between MHO and non-MHO adolescents regarding presence of hypercholesterolemia (TC, LDL-C) or inflammation (CRP). Statistically significant differences were found only regarding altered ALT level and IR. The lower prevalence of IR among MHO adolescents may be explained by use of a coefficient of the HOMA calculation (glycemia) that is part of the MHO definition, which in turn may explain the altered ALT level. Altered ALT level is suggestive of nonalcoholic fatty liver disease, which is associated not only with IR, but also with high level of TGs and low level of HDL-C in overweight adolescents [27].
Together, these results show that the widespread, MS-based definition of MHO is limited in assessing metabolic health in overweight adolescents, suggesting that around half (46.5%) of the adolescents categorized as MHO are not actually metabolically healthy. Thus, a broader definition of MHO may be more accurate for assessment in this context.
There is no consensus on the association of physical activity level and intensity, cardiorespiratory fitness, or sedentary and dietary behaviors with MHO, and the best anthropometric/body composition predictors of MHO status are unknown.
Due to the retrospective design of the study, one of its limitations is the lack of nutritional or physical activity information. This omission prohibits any contribution regarding potential associations between nutrition/physical activity and MHO status. Nevertheless, we found no differences in cardiorespiratory fitness between MHO and non-MHO subjects in the cross-sectional sample of adolescents.
The literature shows that MHO adolescents tend to be younger and have lower BMI/BMI z-score, WC, and % BFM compared to non-MHO adolescents [8,10,11], which is in accordance with our findings. Herein, BMI z-score was the only anthropometric or body composition variable associated with MHO status. Indeed, an increase in BMI z-score not only decreased the odds of MHO (OR, 0.6), but also increased the odds of hypertension (OR, 2.1), IR (OR, 2.4) and of proinflammatory status (OR, 1.2). Additionally, WC was associated with increased odds of abnormal TC level (OR, 1.1) and with number of comorbidities in both groups. This suggests that, even though there are complex interactions among factors that may influence metabolic health in overweight adolescents (e.g., physical activity, cardiorespiratory fitness), presence and severity of overweight may be markers of an unhealthy phenotype, especially regarding maintenance of overweight, as suggested by our findings. Our longitudinal analyses showed that increasing BMI z-score was associated with worsening metabolic risk factors, which is in line with results reported by other authors [28].
Data from the Bogalusa Heart study suggest that MHO children are 2.7–9.3 times more likely to become MHO adults compared with children in other categories [29]. However, according to that study, 67.4% (31 of 46) of MHO children became metabolically unhealthy either as overweight (34.8%) or normal-weight (32.6%) adults. In line with these results, in the present study, 44% of MHO adolescents became non-MHO over time. Although we found no statistically significant associations among BMI/BMI z-score variations and change in MHO status, an increase in BMI z-score increased the odds of hypertension (OR, 1.7), IR (OR, 2.7), and abnormal ALT level (OR, 1.9), predicting in 13.5% the variation in the number of comorbidities observed over time. These results reinforce the idea that an increase in BMI z-score is associated with worsening of cardiometabolic health.
It is a matter of debate whether MHO adolescents stand to benefit from weight-management lifestyle interventions that focus on dietary and physical activity [30]—these adolescents may not gain metabolic health benefits from these interventions as they are already metabolically sound. This study shows that almost half (44%) of adolescents characterized as MHO may develop an unhealthy metabolic phenotype over time (based on the definition of MHO) if a decrease in weight is not achieved, even if these adolescents are enrolled in weight-management lifestyle interventions. Moreover, it is expected that with increasing age, a decrease in physical activity and an increase in sedentary behaviors [31,32] may contribute to increase in % BFM and BMI over time. In addition, because adolescence is a critical period for acquisition of healthy behaviors [33], it seems crucial to influence health behaviors throughout this age period to prevent future health adversities. Thus, MHO adolescents stand to benefit from weight-management lifestyle interventions as much as their non-MHO peers. Indeed, current guidelines recommend weight loss for all children and adolescents classified as overweight, without differentiating between metabolic health phenotypes [34,35]. Instead, these guidelines highlight the need for weight loss prior to weight-related comorbidities, which may lead to severe clinical and psychosocial conditions.
Other limitations of this study are the small sample used in the longitudinal analyses, which represents around 36% of the total sample, and the insufficient data on cardiorespiratory fitness (VO2max) at the second assessment. This insufficient data prohibited cardiorespiratory fitness variation analysis (as well as analysis of its association with MHO phenotype). Even considering these limitations, together with a possible selection bias, the sample used in the longitudinal analyses is a good representation of the total sample (as shown in Table 1). Moreover, inclusion of longitudinal analyses is a strength of this study as the majority of similar studies use a cross-sectional design, prohibiting understanding of the clinical evolution of participants.
Despite its limitations, this study shows that the definition of MHO should not be exclusively based on MS and should include other metabolic indicators commonly affected in overweight populations including TC, LDL-C, CRP, and insulin levels; HOMA-IR; and hepatic function. Stratification of overweight adolescents based on metabolic health phenotype may be relevant to identify those who should be targeted as high priority for more intensive interventions. Nevertheless, it is our conclusion that all overweight adolescents should be enrolled in weight-management lifestyle interventions.
Li et al. [29] cited in their study a well-known expression of Reaven from 2005 stating, "all obese individuals are not created equal," [36] to argue that MHO children may show comparable cardiometabolic profiles to their metabolically healthy normal-weight peers, and that "inequality" in the cardiometabolic consequences of overweight starts in childhood. While we agree with Li et al., the present study raises the question whether this "inequality" may decrease over time when accompanied by increase in overweight severity.
Notes
Ethical statement
This study was approved by the Ethics Committee of the Faculty of Medicine of the University of Lisbon, Portugal (271/2016), and is in accordance with the 1964 Helsinki declaration and its later amendments or comparable ethical standards. Informed assent/consent was provided by all participants and their respective caretakers.
Conflicts of interest
No potential conflict of interest relevant to this article was reported.
Acknowledgements
AVS is supported by the Portuguese Foundation for Science and Technology (SFRH/BD/130193/2017). AVS funding played no role in the study design; collection, analysis, and interpretation of data; writing of the report; or decision to submit the manuscript for publication. The other authors have no financial relationships relevant to this article to disclose. The authors have no potential conflicts of interest to disclose. A proceeding of this study was presented at the 25th European Congress on Obesity in May 2018, in Vienna, Austria.
Supplementary Materials
Supplementary Tables 1 and 2 can be found via https://doi.org/apem.2040052.026.