Association between hemoglobin glycation index and cardiometabolic risk factors in Korean pediatric nondiabetic population
Article information
Abstract
Purpose
The hemoglobin glycation index (HGI) represents the degree of nonenzymatic glycation and has been positively associated with cardiometabolic risk factors (CMRFs) and cardiovascular disease in adults. This study aimed to investigate the association between HGI, components of metabolic syndrome (MS), and alanine aminotransferase (ALT) in a pediatric nondiabetic population.
Methods
Data from 3,885 subjects aged 10–18 years from the Korea National Health and Nutrition Examination Survey (2011–2016) were included. HGI was defined as subtraction of predicted glycated hemoglobin (HbA1c) from measured HbA1c. Participants were divided into 3 groups according to HGI tertile. Components of MS (abdominal obesity, fasting glucose, triglycerides, high-density lipoprotein cholesterol, and blood pressure), and proportion of MS, CMRF clustering (≥2 of MS components), and elevated ALT were compared among the groups.
Results
Body mass index (BMI) z-score, obesity, total cholesterol, ALT, abdominal obesity, elevated triglycerides, and CMRF clustering showed increasing HGI trends from lower-to-higher tertiles. Multiple logistic regression analysis showed the upper HGI tertile was associated with elevated triglycerides (odds ratio, 1.65; 95% confidence interval, 1.18–2.30). Multiple linear regression analysis showed HGI level was significantly associated with BMI z-score, HbA1c, triglycerides, and ALT. When stratified by sex, age group, and BMI category, overweight/obese subjects showed linear HGI trends for presence of CMRF clustering and ALT elevation.
Conclusions
HGI was associated with CMRFs in a Korean pediatric population. High HGI might be an independent risk factor for CMRF clustering and ALT elevation in overweight/obese youth. Further studies are required to establish the clinical relevance of HGI for cardiometabolic health in youth.
Introduction
Prevalence of obesity and type 2 diabetes mellitus (T2DM) in the pediatric population has increased worldwide [1,2]. The same phenomena have been observed in Korean children and adolescents [3,4]. Comorbidities of obesity and complications of T2DM have become important issues in the pediatric population [5,6]. Therefore, prevention of pediatric obesity and T2DM is critical for reducing the burden of these health problems [1,7]. For the earlier intervention, there have been studies conducted for developing and evaluating the markers for these cardiometabolic risk factors (CMRFs) associated with obesity and T2DM [8,9].
Glycated hemoglobin (HbA1c) is an index that reflects the mean blood glucose for the prior 2–3 months and is a gold standard for controlling blood glucose among patients with diabetes mellitus (DM) [10,11]. However, some studies have reported differences in HbA1c in patients with similar mean blood glucose levels [12,13]. Approximately 60%–80% of the HbA1c variance could be explained by mean blood glucose levels, while the rest is influenced by ethnic and genetic factors [14,15], glucose metabolism, and biological factors involved in hemoglobin glycation [16]. A statistical method to quantify the difference between predicted and actual HbA1c levels was provided by Hempe et al. [17], which was termed hemoglobin glycation index (HGI). HGI is defined as the value obtained by subtracting predicted HbA1c from measured HbA1c. Predicted HbA1c is calculated by using equations from linear regression of HbA1c and fasting blood glucose. When HGI is high or low, it means that the measured HbA1c is higher or lower than the predicted HbA1c at the blood glucose level. HGI indicates the degree of nonenzymatic glycation of hemoglobin, which has been positively correlated with complications of DM [18,19]. Moreover, a recent study revealed that HGI is associated with hepatic steatosis in adults without DM, and is considered an emerging risk factor for metabolic syndrome (MS) and future T2DM [20].
However, to date, only one study has been reported about HGI in children with type 1 diabetes mellitus (T1DM), which showed HGI as a robust measure of HbA1c bias [21]. Further, no studies have been performed on the association between HGI and CMRFs in the pediatric population without DM. Therefore, the aim of this study was to describe the distribution of HGI and to investigate the correlation of HGI with MS, its components, and alanine aminotransferase (ALT) as an index of nonalcoholic fatty liver disease (NAFLD) in a pediatric nondiabetic population.
Materials and methods
1. Study subjects
This study was based on data from the Korea National Health and Nutrition Examination Survey (KNHANES) 2011–2016. This cross-sectional nationwide survey, conducted by the Korea Centers for Disease Control and Prevention (KCDC), used a multistage, stratified, and clustered probability sampling method to select a representative sample of the Korean civilian population. Of the total 47,164 participants, children and adolescents aged between 10 and 18 years were selected (n=5,043). Exclusion criteria were as follows: subjects who fasted less than 8 hours before blood sampling (n=553); absence of results of fasting glucose or elevated fasting glucose values of ≥126 mg/dL (n=1,050); absence of results of HbA1c or elevated HbA1c of ≥6.5% (n=1,074); previously diagnosed DM (n=3); pregnancy (n=0); absence of any component of MS (n=1,105), and absence of anthropometric measurements (n=382). Finally, 3,885 participants (2,074 young males and 1,811 young females) were eligible for the analysis (Fig. 1).
2. Anthropometric and laboratory data
Anthropometric measurements were performed on all participants by trained personnel. Height was measured to the nearest 0.1 cm by using a stadiometer (Seca 225, Seca, Hamburg, Germany). Weight was measured by using an electronic balance (GL-600020, G-tech, Seoul, Korea) to the nearest 0.1 kg, and body mass index (BMI) was calculated as weight (kg) divided by height squared (m2). Height and BMI were transformed into z-scores by using the 2017 Korean National Growth Charts [22]. Waist circumference (WC) was measured to the nearest 0.1 cm by using a flexible tape measure, from the midpoint between the lowest border of the rib cage and the uppermost border of the iliac crest at the end of expiration (Seca 220, Seca). Blood pressure (BP) was measured by using a mercury sphygmomanometer (Baumanometer Desk model 0320 in 2011–2012 and Baumanometer Wall Unit 33[0850] in 2013–2016, Baum, NY, USA) on the right arm after the subject had rested for at least 5 minutes in a seated position. BP was measured 3 times, and the mean of the last 2 values were used for the analyses.
Fasting blood samples were collected from each participant by trained medical personnel. Plasma glucose, total cholesterol, high-density lipoprotein cholesterol (HDL-C), triglyceride (TG), aspartate aminotransferase, and ALT were measured by using a Hitachi Automatic Analyzer 7600 (Hitachi, Tokyo, Japan). The level of HbA1c was measured by using high performance liquid chromatography (HLC-723G7, Tosoh, Tokyo, Japan), which was the certified method by the National Glycohemoglobin Standardization Program. All laboratory tests were performed in the Central Laboratory.
3. Definition of HGI and MS
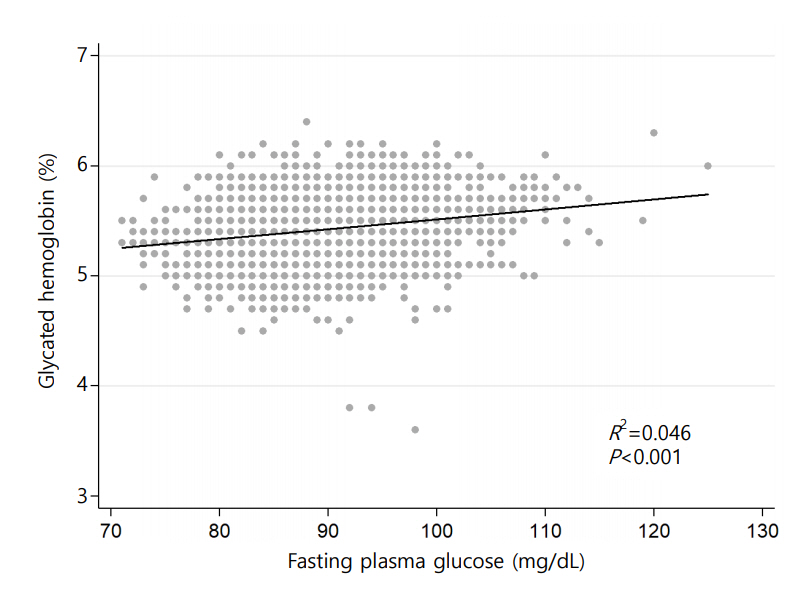
HGI was defined as the difference between measured HbA1c and predicted HbA1c (HGI=measured HbA1c–predicted HbA1c). Predicted HbA1c was calculated by using the following formula through individual measurements of fasting plasma glucose (FPG), which were derived from linear regression analysis of measured HbA1c and fasting glucose (HbA1c (%)=0.0089×FPG [mg/dL]+4.6173 [R-squared=0.0466, P<0.001]) (Fig. 2). Study subjects were classified into 3 groups according to the tertile of HGI.
MS was defined by using the International Diabetes Federation criteria [23]. MS was confirmed, when a subject had abdominal obesity with 2 or more abnormalities in the following 4 measurements: TG, HDL-C, BP, and FPG. Abdominal obesity was defined when WC was ≥90th percentile in those aged 10–15 years or WC was ≥90 cm in males and ≥85 cm in females aged 16–18 years. Abnormal results were defined as follows: systolic or diastolic BP≥130/85 mmHg, FPG≥100 mg/dL, TG≥150 mg/dL, HDL-C<40 mg/dL in males aged 10–18 years and females aged 10–15 years, and <50 mg/dL in females aged between 16 and 18 years. CMRF clustering was defined as the presence of ≥2 abnormal components of MS [8,24]. ALT was used as a marker for NAFLD in a pediatric population [25]. ALT elevation was defined as ≥30 IU/L for males and ≥19 IU/L for females [26,27].
4. Statistical analysis
Data were analyzed using Stata 14.2 (StataCorp LP, College Station, TX, USA) with svy commands appropriate for the KNHANES sampling design. Data were expressed as the means±standard error for continuous variables or number of subjects (weighted percent) for categorical variables. Linear regression analysis was used to calculate predicted HGI values. Clinical characteristics were compared between tertiles of HGI by using the Student t-test or regression analysis for continuous variables, or logistic regression analysis and chi-square test for categorical variables. P-value for comparison between tertiles and P for trend from the lower to the upper HGI tertiles were obtained. Multiple logistic regression analysis was performed to determine the odds ratio (OR) with 95% confidence interval (CI) for association between HGI and components of MS and elevated ALT with adjustment for hemoglobin and BMI z-score. Further multiple logistic regression analyses were performed to identify association between HGI and CMRF clustering, MS and ALT elevation, after stratification by sex, age group (10–14 years and 15–18 years) and BMI category (normal weight and overweight/obese). Association between HGI and CMRFs were analyzed using simple and multiple linear regression analysis adjusting hemoglobin and BMI z-score. Due to the multicollinearity, HbA1c and HGI was not used in the same analysis. A P value of <0.05 was considered statistically significant.
5. Ethics statement
The KNHANES was approved by the Institutional Review Board of the KCDC (2011-02CON-06-C, 2012-01EXP-01-2C, 2013-07CON-03-4C, 2013-12EXP-03-5C). Written informed consent was obtained from all participants prior to the survey. The present study was approved by the Institutional Review Board of the Seoul National University Bundang Hospital (approval number: X-1807/483-902).
Results
1. Clinical characteristics of study participants by HGI tertiles
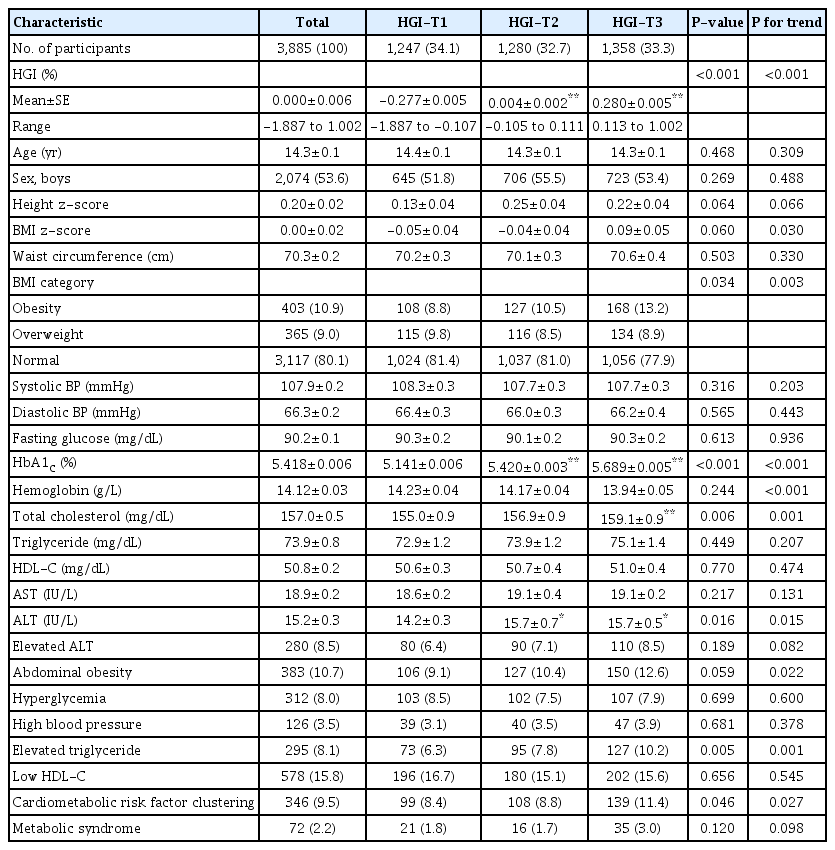
The mean of HGI (%) was 0.000±0.006, with a range of between -1.887 and 1.002. The mean and range of HGI by lower (HGI-T1), mid (HGI-T2), and upper (HGI-T3) tertiles were -0.277±0.006 (-1.887 to -0.107), 0.000±0.005 (-0.105 to 0.111), and 0.280±0.005 (0.113 to 1.002), respectively. The cumulative proportion of HGI according to measured HbA1c is presented in Fig. 3.
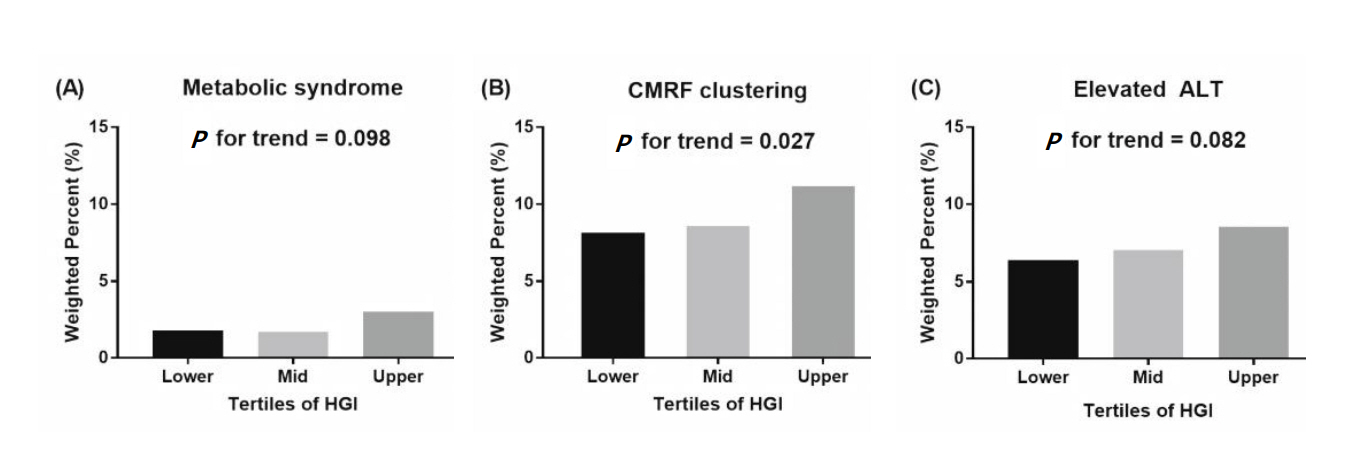
The anthropometric and metabolic characteristics of study participants according to tertiles of HGI values are shown in Table 1. The mean age was 14.3±0.1 years, and 53.6% of participants were males. Overweight or obese subjects were 19.9% (n=768). Participants were divided into 2 age groups; 10–14 years (n=2,253, 48.8%) and 15–18 years (n=1,632, 51.2%). No significant differences between the groups were observed for age, sex, height z-scores, and WC. BMI z-scores and proportion of obesity increased with respect to HGI tertile. Subjects in higher HGI tertiles had higher values of HbA1c, without differences in FPG. Serum level of total cholesterol and ALT statistically significantly increased with increasing HGI (Table 1). Proportion of abdominal obesity, elevated TG, and CMRF clustering showed an increasing tendency with respect to HGI tertile (Fig. 4). However, proportion of MS, hyperglycemia, high BP, low HDL-C, and elevated ALT did not reveal differences among the groups (Fig. 4).
2. Association between HGI and components of MS
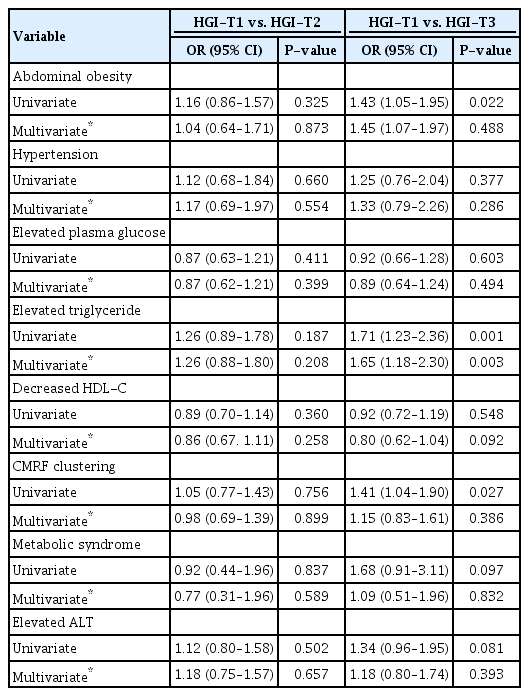
There was no significant difference in components of MS and elevated ALT between HGI-T1 and HGI-T2 (Table 2). However, adjusted OR (95% CI) of elevated TG in HGI-T3 as compared with that in HGI-T1 was 1.65 (1.18–2.30). Other components, including MS and elevated ALT, did not show statistical significance.
In linear regression analysis, BMI z-score, HbA1c, TG, and ALT showed a significant positive association with HGI after adjusting BMI z-score and hemoglobin (Table 3). WC, BP, FPG, and HDL-C were not associated with HGI.
When stratified according to sex, age group, and BMI category, those overweight and obese showed increased OR for predicting CMRF clustering and ALT elevation with respect to the HGI (Table 4). OR (95% CI) for predicting CMRF clustering and ALT elevation in overweight/obese participants was 2.92 (1.47–5.80) and 2.72 (1.24–5.98), respectively. However, HGI was not significant for predicting MS.
Discussion
In this cross-sectional study of Korean adolescents, HGI was associated with CMRFs. BMI z-score, HbA1c, TG, and ALT levels showed linear correlation with HGI. Moreover, elevated TG was independently associated with HGI levels after adjusting for BMI z-score and hemoglobin. In overweight/obese subjects, HGI was associated with CMRF clustering and elevated ALT.
People with consistently higher or lower HbA1c values than their glucose values have been classified as high and low glycators, respectively. HGI is a quantification of the difference between measured HbA1c and predicted HbA1c, which is thought to represent the difference in glycation of hemoglobin among people with the same FPG. In T1DM patients, the higher the HGI level, the more microvascular complications such as retinopathy and nephropathy have been observed [28]. Moreover, a correlation between glycation gap and micro- and macrovascular complications has been reported in patients with T2DM [29]. One recent study reported that the higher the HGI level was, the higher was the risk of atherosclerosis and coronary artery calcification, which is a cardiovascular disease risk, even in nondiabetic adults [19]. These data support the fact that nonenzymatic protein glycation is one of the key players in explaining micro- and macrovascular complications associated with hyperglycemia. To the best of the authors' knowledge, the present study is the first study to investigate the clinical relevance of HGI and association between HGI and CMRFs and ALT in the pediatric non-diabetic population by using nationally representative data.
MS is a combination of 3 out of 5 risk factors, such as abdominal obesity, elevated BP, high fasting glucose, high TG, and low HDL-C. A better understanding of the metabolic abnormalities in adolescence could lead to preventive interventions that could improve adolescents' health outcomes and contribute to a reduction in cardiovascular disease in adults [30,31]. In recent years, concerns have been raised about issues with difficulties in defining and applying MS to youth in clinical practice, therefore, it is important to individually evaluate and manage these cases with a focus to CMRF clustering [24].
In the present study, TG was associated with HGI. High TG levels were observed in the state with decreased insulin sensitivity, which was related to glucose metabolism in muscles [32,33]. HGI might be associated with the insulin resistance, which was an underlying mechanism of MS [24]. The relationship between HGI and MS was not significant, although HGI and CMRF clustering were significantly associated. This suggests that the duration of exposure to higher levels of glucose or variation of glucose levels were relatively short and small in early childhood and adolescent periods for the occurrence of metabolic derangements. It might the affect the numbers of CMRFs in the study participants.
Overweight/obese subjects showed significant correlation between HGI and CMRF clustering, although HGI was not significantly different between groups by BMI category (normal weight -0.005 versus overweight/obese 0.018, P=0.052). Overweight/obese youth with higher HGI might have the more active the intracellular protein glycation process than those with normal weight, which could make difference in association with CMRF clustering according to BMI category. Therefore, HGI might be an alternative marker for an increased cardiometabolic risk in the pediatric population.
NAFLD has become a significant cause of chronic liver disease in childhood. It is associated with obesity, which might be considered as hepatic manifestation of MS [34]. Although liver biopsy has been considered the gold standard for diagnosing NAFLD, its invasiveness frequently makes it difficult to perform [25]. Currently, ALT is used as a surrogate marker of NAFLD. In a recent study, a correlation was found between elevated ALT (>30 IU/L for males and >19 IU/L for females) and MS and insulin resistance in Korean adolescents [26]. In adults, high HGI was associated with hepatic steatosis in nondiabetic population [20]. In the present study, ALT was associated with higher HGI values in overweight/obese group. Further study is required to elucidate the association between HGI and NAFLD in pediatric population.
The limitation of this study is that its design was crosssectional, making it difficult to understand the causal relationship. However, the present study is the first study to investigate the clinical relevance of HGI and to evaluate the association between HGI and CMRFs and ALT in the pediatric nondiabetic population by using nationally representative data.
In this study, HGI was associated with CMRFs, including BMI z-scores, obesity, total cholesterol, ALT, abdominal obesity, elevated TG levels, and CMRF clustering in a pediatric nondiabetic population. When stratified for sex, age group, and BMI category, overweight/obese subjects showed linear trends for the presence of CMRF clustering and ALT elevation with respect to increases in HGI. We, therefore, suggest that there is a possibility that HGI might be used as an alternative marker for cardiovascular diseases in a pediatric population. However, further longitudinal studies are warranted to investigate clinical implications of HGI in children and adolescents.
Notes
Conflict of interest: No potential conflict of interest relevant to this article was reported.


