Ultrasound measurement of pediatric visceral fat thickness: correlations with metabolic and liver profiles
Article information
Abstract
Purpose
Abdominal obesity is a fundamental factor underlying the development of metabolic syndrome. Because of radiation exposure and cost, computed tomography or dual-energy X-ray absorptiometry to evaluate abdominal adiposity are not appropriate in children. Authors evaluated whether ultrasound results could be an indicator of insulin resistance and nonalcoholic fatty liver disease (NAFLD).
Methods
We enrolled 73 subjects (aged 6–16 years) who were evaluated abdominal adiposity by ultrasound. Subcutaneous fat thickness was defined as the measurement from the skin-fat interface to the linea alba, and visceral fat thickness (VFT) was defined as the thickness from the linea alba to the aorta. Anthropometric and biochemical metabolic parameters were also collected and compared. The subjects who met 2 criteria, radiologic confirmed fatty liver and alanine aminotransferase >40, were diagnosed with NAFLD.
Results
There was a strong positive correlation between VFT and obesity. VFT was highly correlated with the homeostasis model assessment for insulin resistance score (r=0.403, P<0.001). The area under the curve for VFT as a predictor of NAFLD was 0.875 (95% confidence interval [CI], 0.787–0.964). VFT of 34.3 mm was found to be the discriminating cutoff for NAFLD (sensitivity, 84.6%; specificity, 71.2%, respectively).
Conclusion
Ultrasound could be useful in measuring VFT and assessing abdominal adiposity in children. Moreover, increased VFT might be an appropriate prognostic factor for insulin resistance and NAFLD.
Introduction
In recent years, obesity has become a major public health and medical care problem. The rates of overweight and obese children and adolescents continue to increase rapidly, and the World Health Organization classifies obesity as a disease1). The prevalence of childhood obesity has also increased in Korea2). The prevalence of obesity in 10- to 14-year-old males in Seoul has increased 10 fold from 1.7% to 17.9% between 1999 and 2002. This is as high as the 14%–17% rate in the United States34).
Obesity is closely associated with insulin resistance, dyslipidemia, hypertension, cardiovascular disease, and fatty liver. Hemodynamic and metabolic changes are related and play important roles in the development of metabolic syndrome5). The amount of body fat itself is a risk factor; however, body fat distribution, particularly abdominal obesity, is a crucial risk factor for metabolic syndrome and cardiovascular disease67). Furthermore, the prevalence of nonalcoholic fatty liver disease (NAFLD), which is linked with high abdominal fat, is increasing in children. Thus, identifying and measuring abdominal fat content are important for evaluating obesity in this vulnerable population.
Computed tomography (CT) and dual-energy X-ray absorptiometry (DEXA) are commonly used methods to measure abdominal obesity in adults. However, the high cost and radiation exposure make them challenging to use in children and adolescents in clinical settings89).
Since Armellini et al.10) first suggested the utility of ultrasound to measure abdominal fat in 1990, many studies have employed this method11). One study reported a high correlation for abdominal fat measurement between ultrasound and CT12). Although ultrasound might be a good method to replace CT in adults, there are few studies in pediatric populations.
In this study, we investigated the utility of ultrasound in measuring abdominal fat and the relationship of this value with obesity indicators. We also evaluated whether the results of ultrasound could be an indicator of insulin resistance and NAFLD.
Materials and methods
We retrospectively analyzed data from 73 subjects (aged 6–16 years) who visited the Gangnam Severance Hospital, Yonsei University between January 2013 and December 2014, for obesity and growth assessment that included ultrasound and blood testing. We excluded patients who might have diseases that can interrupt normal growth. This study was approved by the Institutional Review Board of Yonsei University Gangnam Severance Hospital (approval number: 3-2015-0099).
We performed ultrasound evaluation to measure abdominal obesity, including visceral fat thickness (VFT) and subcutaneous fat thickness (SFT). Ultrasonography was performed with a high-resolution ultrasonographic system (SA 9900; Medison, Seoul, Korea). VFT was defined as the thickness of fat tissue between the linea alba and aorta, and SFT was defined as fat tissue thickness from the skin-fat interface to the linea alba. Transverse scanning was performed to measure the maximum SFT and VFT using 7.5- and 3.5-MHz probes, respectively. Both measures were obtained 1 cm above the umbilicus by the same pediatric radiologist.
Anthropometric data, and biochemical measurements were collected by nurse. Participants underwent a standard examination and testing including measurement of height, weight, body mass index (BMI), lipid profiles, aspartate aminotransferase (AST), alanine aminotransferase (ALT), protein, and albumin. The height and weight were measured to the nearest 0.1 cm and 0.1 kg, respectively, while the subjects were wearing light clothing and not wearing shoes. The waist circumference was measured at the midpoint between the lateral iliac crest and the lowest rib. The homeostasis model assessment for insulin resistance (HOMA-IR) score was used as an indicator of insulin resistance13). We defined standard deviation score for height, weight, and BMI based on the 2007 Korean National Growth Charts14). The subjects who met 2 criteria, radiologic confirmed fatty liver and ALT>40, were diagnosed with NAFLD. We divided the participants into 3 groups. BMI percentiles above the 95th percentile are labeled 'overweight,' BMI percentiles between the 85th and 95th percentiles are labeled 'at risk for overweight,' and BMI percentiles below the 85th are 'normal'15).
Statistical analyses were performed with SAS ver. 9.2 (SAS Institute, Cary, NC, USA). Associations between continuous variables were determined using Pearson correlation coefficients. Intergroup comparisons were performed with independent-sample t-tests. Multiple regression tests were used to verify the association of VFT and insulin resistance. Analyses of variance and Fisher exact tests were used to compare the 3 groups. A receiver operating characteristic (ROC) curve was used to determine the appropriate VFT cutoff value. Differences were considered significant at P<0.05.
Results
We analyzed the baseline clinical and biochemical parameters, and Table 1 shows the mean and standard deviation values for the 47 males and 26 females enrolled in this study. The mean BMI z-score of the participants was 1.7, indicating that most subjects were overweight or obese.
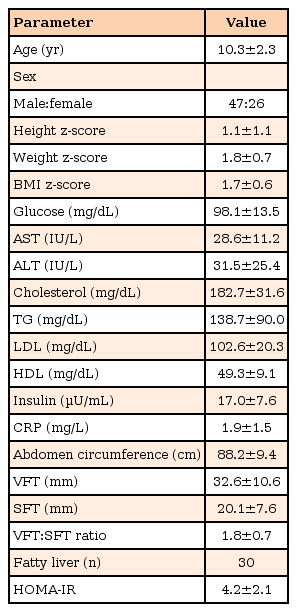
Anthropometric data (n=73)
The subjects were classified into 3 groups based on BMI percentile groups (Table 2). We identified the increasing trends of ALT, insulin, abdomen circumference, VFT, SFT, and HOMA-IR in 3 groups. There were no significant differences in glucose and high-density lipoprotein (HDL) among the 3 groups. The number of fatty liver was 2 of 9 (22.2%) in BMI <85th percentile group, 7 of 27 (25.9%) in BMI 85th–95th percentile group, and 21 of 37 (56.8%) in BMI >95th percentile group (P=0.024). We also observed a significant difference of HOMA-IR score, which represented insulin resistance (P=0.008).
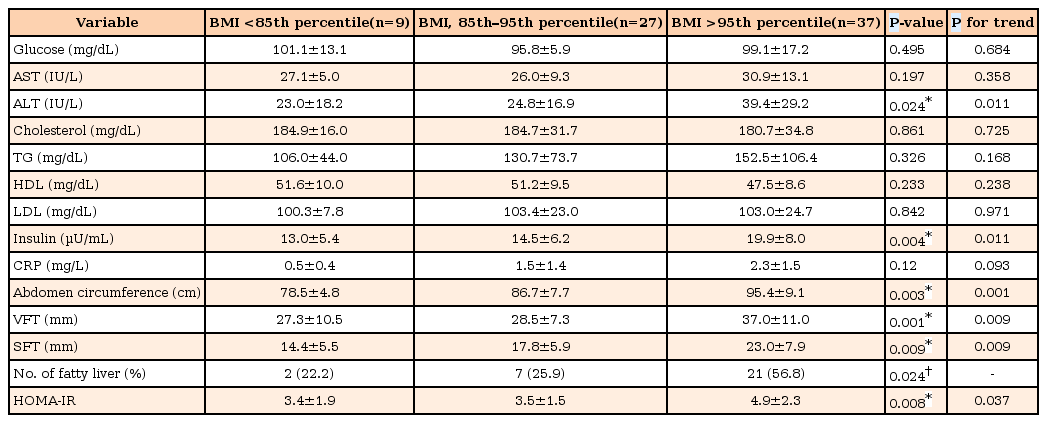
Comparison of clinical characteristics among the three BMI percentile groups
Table 3 shows the Pearson correlation coefficients between VFT and biochemical factors. As well as BMI z-score, most biochemical data were highly correlated with VFT. The measures most highly correlated with VFT were ALT, insulin, and HOMA-IR.
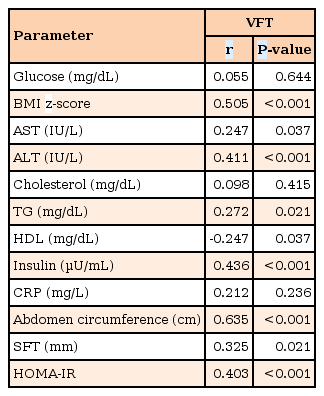
Pearson correlation coefficients of biochemical factors to VFT
The variances of biochemical factors explaining HOMA-IR obtained with multiple regression analysis are shown in Table 4. Age (P=0.022), BMI z-score (P=0.024), abdomen circumference (P=0.016), VFT (P=0.048) were independent determinants of HOMA-IR (R2 of the model=0.278).
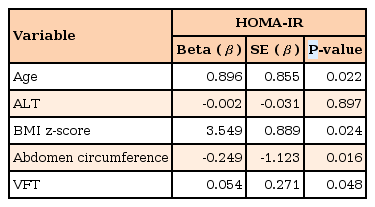
Multiple regression analysis variances of biochemical factors explaining HOMA-IR
The area under the ROC curve for VFT as a predictor of elevated ALT was 0.849 (95% confidence interval [CI], 0.735–0.963). Relative to VFT 32.0 mm, the sensitivity and specificity to predict ALT >40 IU/L were 88.2% and 74.1%, respectively. ROC analysis of VFT to predict the presence of fatty liver yielded an area under the curve of 0.751 (95% CI, 0.643–0.859). Relative to VFT 31.8 mm, the sensitivity and specificity to diagnose radiologic fatty liver were 71.0% and 77.5%, respectively. The ROC for VFT as a predictor of NAFLD was 0.875 (95% CI, 0.787–0.964). VFT 34.3 mm, the sensitivity and specificity to diagnose NAFLD were 84.6% and 71.2% (Fig. 1).
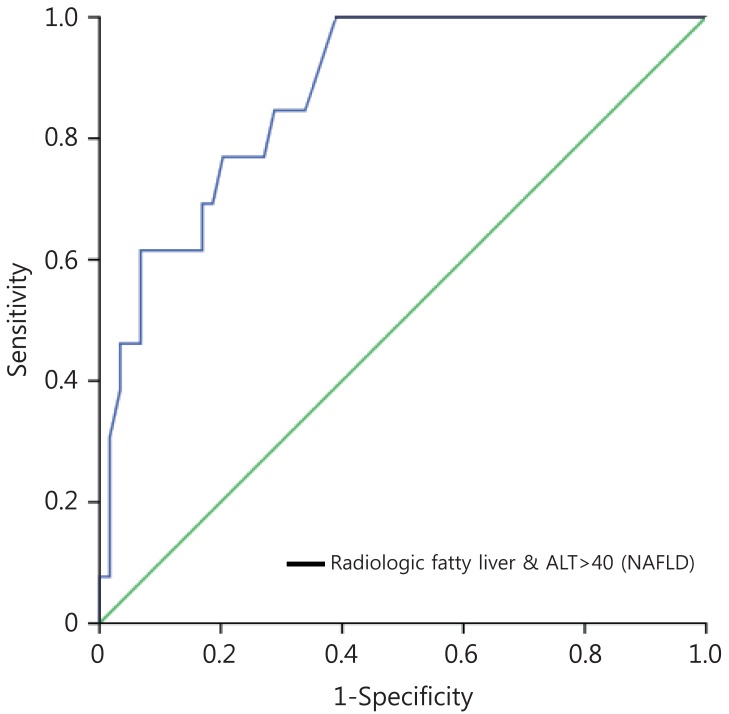
Receiver operating characteristic (ROC) analysis of visceral fat thickness (VFT) as a predictor of nonalcoholic fatty liver disease (NAFLD). The ROC for VFT as a predictor of NAFLD was 0.875 (95% confidence interval, 0.787–0.964). VFT of 34.3 mm was found to be the discriminating cutoff for NAFLD (sensitivity, 84.6%; specificity, 71.2%, respectively). ALT, alanine aminotransferase.
Discussion
Obesity is increasing at a rapid pace, and related complications are growing problems in both adults and children. BMI is widely used as a standard for determining whether subjects are overweight or obese16). However, BMI does not reflect body fat distribution. Especially in children, BMI does not adequately assess abdominal obesity because the amount of change in body fat varies depending on growth and development according to age1718).
Fat distribution is a more important independent risk factor for cardiovascular disease than percent body fat in children and adolescents. A higher fat distribution in the abdomen is associated with increases in insulin resistance, hyperinsulinemia, and triglycerides (TG), decreased HDL cholesterol, high blood pressure, and the risk of cardiovascular disease192021). Greater central fat deposition is also associated with less favorable plasma lipid and lipoprotein concentrations, high blood pressure, and greater left ventricular mass2223). Therefore, we evaluated central obesity by measuring VFT with ultrasound and found strong positive correlations with liver enzyme and TG levels, and a negative correlation with HDL levels. These findings are consistent with previous studies2425). As well as BMI, VFT had high correlations with metabolic biomarkers such as AST, TG, HDL, and serum insulin levels.
A high correlation between central obesity and insulin resistance has been reported26). Adipose tissue modulates metabolism by releasing nonesterified fatty acids, glycerol, hormones including leptin and adiponectin, and proinflammatory cytokines27). The production of these products is increased in the setting of central obesity28). However, insulin resistance also frequently occurs in apparently lean individuals. In a previous study, visceral fat was more strongly correlated with insulin resistance than subcutaneous fat29). In this study, there was also a high correlation between VFT and HOMA-IR, which is an indicator of insulin resistance. Thus, among central obesity measurements, visceral fat accumulation is more useful than other markers.
The rise in the incidence of obesity in children is paralleled by higher rates of fatty liver. NAFLD has become one of the most common chronic hepatopathies in children. Its histologically proven prevalence in children in the United States ranges from 9.6% in normal-weight individuals up to 38% in obese subjects30). Nonalcoholic steatohepatitis (NASH) is a subtype of NAFLD accompanied by hepatocyte ballooning and necrosis with or without Mallory's hyaline and fibrosis, and it is potentially progressive in pediatric subjects. Children with NASH may progress to liver cirrhosis and end-stage liver disease with a consequent need for liver transplantation31). Due to its tendency to progress during childhood or after transition into adulthood, early diagnosis and treatment are important. However, NASH is still underdiagnosed in children because the standard confirmatory test is liver biopsy, which has limitations in this population. Ultrasound is the most common imaging technique used for NAFLD screening, but it alone is not sufficient for diagnosis because radiological findings cannot distinguish between NASH and other forms of NAFLD32). We identified a significant relationship between VFT and altered lipid profile, elevated ALT, and insulin resistance. A VFT of 34.3 mm was a cutoff value to support the diagnosis of NAFLD (sensitivity, 84.6%; specificity, 71.2%). Therefore, measuring VFT can be a useful technique to increase NAFLD diagnostic accuracy.
There are several limitations to our analysis. First, because it was a cross-sectional study, the results do not shed light on age-related changes. Longitudinal analyses are needed to clarify this important issue. Second, our analysis was performed in Korean population, and the VFT cutoff values may differ among ethnic groups. Third, there is a lack of data showing a correlation between VFT and pathologically proven NASH, and comparisons with more established methods such as CT and DXEA. Fourth, by targeting a wide age group, it did not reflect the normal skin and fat thickness variation. Fifth, there was no comparison data about SFT. These issues should be considered when designing future clinical studies.
In conclusion, ultrasound could be useful for measuring abdominal fat thickness and assessing central obesity in children and adolescents. Moreover, ultrasound-measured VFT is an appropriate prognostic factor for ALT elevation, insulin resistance, and NAFLD. Although measuring VFT by ultrasound is not sufficient to determine if a subject has metabolic syndrome or NASH, our results demonstrate that the addition of ultrasound-measured VFT significantly improved the prediction of metabolic changes or NAFLD. Ultrasonography is an inexpensive and noninvasive method compared to CT or DEXA. In the future, it can be a helpful adjunct for increasing the accuracy of diagnosing NAFLD and NASH.
Acknowledgments
We would like to thank Jung Hwa Hong for statistical support.
Notes
Conflict of interest: No potential conflict of interest relevant to this article was reported.