Risk factors of vitamin D deficiency in children with epilepsy taking anticonvulsants at initial and during follow-up
Article information
Abstract
Purpose
Vitamin D status was evaluated in children with epilepsy taking anticonvulsants to determine the prevalence and risk factors of vitamin D deficiency.
Methods
This study was designed as both a cross-sectional and a retrospective cohort study. A sum of 198 children who were diagnosed with epilepsy at the Department of Pediatrics in Dankook University Hospital was included. Their serum vitamin D levels were reviewed based on clinical information, and analyzed using IBM SPSS ver. 20.0.
Results
One hundred twenty-four children (62.6%) had vitamin D deficiency. Two risk factors were associated: winter to spring season (odds ratio [OR], 3.71; 95% confidence interval [CI], 1.835-7.492) and age more than 12 years (OR, 3.22; 95% CI, 1.377-7.542). Out of the 57 patients who were not vitamin D deficient at the time of initial assay, 47 patients (82.5%) became vitamin D deficient during followup. The change of serum 25-hydroxy vitamin D3 (25(OH)D) levels during follow up showed a weak negative correlation with the duration of medication (r=-0.283, P=0.033). Medication duration was longer and brain magnetic resonance imaging (MRI) abnormality, abnormal underlying conditions, and nonambulatory status were more frequently present in twenty-five patients (44%) who showed a decline of more than 15 ng/mL during follow-up (P<0.05).
Conclusion
Vitamin D deficiency is common in children with epilepsy taking anticonvulsants, especially in adolescents more than 12 years of age. This study emphasizes the regular monitoring of vitamin D level, especially in the presence of longer duration of medication, brain MRI abnormality, abnormal underlying conditions, and nonambulatory status.
Introduction
Vitamin D deficiency is an emerging medical issue due to its high prevalence and important role in human health. Vitamin D plays a critical role in calcium and bone metabolism. Vitamin D plays multiple roles including increasing the absorption of calcium and phosphorus in the intestine and inhibiting the secretion of parathyroid hormone. Therefore, vitamin D deficiency may cause rickets, osteopenia, and osteoporosis. It is also reported that vitamin D deficiency has been associated with increased risk of many diseases including cancers, autoimmune diseases, hypertension, and infectious diseases1).
Vitamin D deficiency in the general population is relatively common. In 2008, Gordon et al.2) reported that the prevalence of vitamin D deficiency (≤20 ng/mL) was 12.1% among healthy infants and toddlers. In 2009, Saintonge et al.3) documented that 14% of healthy adolescents aged from 12 to 19 years in the United States suffer from vitamin D deficiency. Recent data from the Korean healthy adolescents aged from 10 to 18 years reported that overall 68.1% had poor vitamin D status with their serum 25-hydroxy vitamin D3 (25[OH]D) level marking lower than 20 ng/mL4). Recently reported prevalence of vitamin D deficiency in Korean children with epilepsy on anticonvulsants was 61.5%5), which is comparable to the Swiss study which reported 55% prevalence of vitamin D deficiency in children on anticonvulsants6). The major cause of vitamin D deficiency may be insufficient exposure to sunlight. Obesity and antiepileptic drugs are also considered to be associated with vitamin D deficiency789). Hahn et el.10) reported that chronic anticonvulsant therapy resulted in accelerated conversion of vitamin D and its active metabolite, 25-hydroxycholecalciferol, to inactive metabolites by inducing liver microsomal enzymes. Pascussi et el.11) reported that phenobarbital led to the upregulation of 25-hydroxyvitamin D3-24-hydroxylase (CYP24) gene expression through the activation of the nuclear receptor pregnane X receptor. CYP24 is a mitochondrial enzyme responsible for inactivating vitamin D metabolites. Therefore, children on antiepileptic drugs are more likely to develop vitamin D deficiency8).
In this study, we evaluated vitamin D status in children with epilepsy who are taking anticonvulsants to determine the prevalence and risk factors of vitamin D deficiency at initial and during follow-up.
Materials and methods
This study was designed as both a cross-sectional and a retrospective cohort study. A total of 198 children diagnosed with epilepsy at the Department of Pediatrics in Dankook University Hospital, Cheonan, Korea was included. The residence of study subjects was 36.46 to 36.96 degrees North Latitude. Clinical and laboratory data were retrospectively reviewed based on medical records. Vitamin D status of all patients was evaluated by the serum level of 25(OH)D using chemiluminescent microparticle immunoassay (Abbott Laboratories, Barcelona, Spain). Vitamin D deficiency was defined as serum 25(OH)D levels below 20 ng/mL, according to the cutoff value based on the Endocrine Society Clinical Practice Guideline 201112).
All of the study subjects were not given with vitamin D supplement at the time of the initial assay, and those who were diagnosed with vitamin D deficiency were supplemented with vitamin D and were excluded from further analysis of the study. Study subjects were categorized into 2 groups according to the initial vitamin D levels: vitamin D deficiency and nondeficiency groups. Patients in the nondeficiency group were then followed and subdivided based on the resultant vitamin D level during follow-up: deficiency and nondeficiency groups. Sex, gestational age, birth weight, age at the time of assay, season at the time of assay, height and weight and body mass index (BMI) z-scores, duration of anticonvulsants at the time of assay, number and type of anticonvulsants, findings on brain magnetic resonance imaging (MRI), underlying diseases, ambulation ability, and blood chemistry were analyzed.
Abnormal MRI findings included periventricular leukomalacia, brain atrophy, porencephaly, tuberous sclerosis, the agyriapachygyria complex, hydrocephalus, encephalomalacia, corpus callosum agenesis, Mitochondrial encephalomyopathy, lactic acidosis, and stroke-like episodes syndrome, and calcifications. Height and weight and BMI z-scores were derived from LMS (Box-cox power, Median, Coefficient of variation) values presented by 2007 Korean Growth Normogram.
1. Statistical analysis
Statistical analyses were performed using IBM SPSS Statistics ver. 20.0 (IBM Co., Armonk, NY, USA). Mann-Whitney U test and chi-square test were used to compare continuous and categorical variables between groups, respectively. A paired t-test was used to evaluate changes between two time points (values at the recent follow-up subtracted from values at the time of initial assay) to compare the initial serum 25(OH)D level with that at the last follow-up. Both univariate and multivariate logistic regression were used to evaluate the risk factors of vitamin D deficiency. Pearson correlation analysis was used to evaluate the relationship between the change in serum 25(OH) D levels and the duration of medication or duration of followup. Kaplan-Meier survival analysis was used to investigate the change in vitamin D status from nondeficient to deficient status during follow-up. A P-value of less than 0.05 was considered statistically significant.
2. Ethics statement
The study was approved by the Institutional Review Board of Dankook University Hospital (IRB No.: 2015-08-010).
Results
1. Demographics and characteristics of the study populations at the time of initial assay
One hundred ninety-eight patients were included in the study. Among them, 102 were males and 96 were females. Eighteen out of 136 patients were premature, and 29 out of 173 patients were low birth weight infants (Table 1). Underlying conditions in all patients were checked. There were 18 patients with mental retardation, 20 patients with cerebral palsy, and 21 patients with mental retardation and cerebral palsy. Among all of the patients, 33 were incapable of ambulation. Seasons at the time of assay were also taken into consideration. Forty-eight cases were evaluated in the spring season, and 61 cases, 24 cases, and 65 cases were evaluated in the summer, fall, and winter seasons, respectively.

Clinical and laboratory characteristics of the study subjects at initial assay and comparison according to the initial vitamin D status
The mean age of all subjects at the time of initial assay was 11.45±4.44 years, and 95 patients (48%) were more than 12 years old. Mean duration of medication at the time of initial assay was 3.95±3.56 years. Mean serum calcium, phosphorus, and alkaline phosphatase were 9.42±0.42 mg/dL, 4.63±0.79 mg/dL, and 214.94±149.37 IU/L, respectively. Mean serum 25(OH)D level at the time of initial assay was 21.99±22.12 ng/mL (Table 1). Mean BMI z-score of all patients was -0.0926±1.21, 24 patients (12.1%) were overweight, and 8 patients (4%) were obese. Among the total study subjects, 143 patients were on monotherapy (72.2%). Valproate (84 subjects, 42.4%) was the most commonly used anticonvulsant followed by oxcarbazepine (55 subjects, 27.8%) and lamotrigine (48 subjects, 24.2%). Among the 184 patients evaluated with brain MRI, 51 patients (27.7%) showed abnormal findings (Table 1).
2. Comparison between the group with vitamin D deficiency and the group without vitamin D deficiency at the time of initial assay
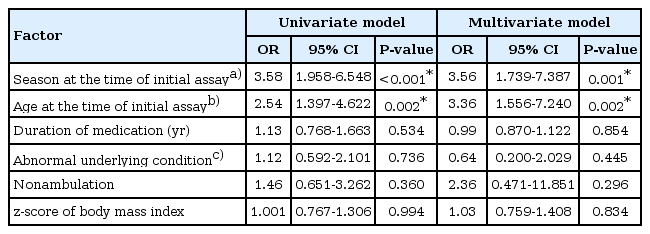
Study subjects were divided according to the vitamin D status at the time of initial assay, and clinical characteristics as well as laboratory results were compared. One hundred twentyfour patients (62.6%) were categorized into the group with vitamin D deficiency, consisting of 68 males and 56 females. Vitamin D deficiency was more common in the winter to spring season (P<0.001), and mean age at the time of initial assay was significantly higher in the group with vitamin D deficiency (12.07±4.54 years vs. 10.41±4.09 years, P=0.007) (Table 1). Vitamin D deficiency was more frequently observed in the patients aged more than 12 years (73% vs. 27%, P=0.002). Patients with vitamin D deficiency showed a lower calcium level (9.36±0.39 mg/dL vs. 9.54±0.44 mg/dL, P=0.005), although there was no significant correlation between calcium level and vitamin D level (r=0.106, P>0.05). By multivariate analysis, we found two risk factors associated with vitamin D deficiency; winter to spring season compared to summer to fall season (odds ratio [OR], 3.56; 95% confidence interval [CI], 1.739-7.387) and age more than 12 years (OR, 3.36; 95% CI, 1.556-7.240) (Table 2).
Risk factors in children with vitamin D deficiency compared to children without vitamin D deficiency
There were no statistically significant differences in gender, gestational age, birth weight, underlying conditions, ambulation ability, mean duration of medication, mean serum phosphorus and alkaline phosphatase levels, height and weight and BMI z-scores, medication type (monotherapy vs. polytherapy; nonenzyme inducing AED vs. enzyme inducing AED), mean number of medications, and findings on brain MRI between the group with vitamin D deficiency and the group without vitamin D deficiency.
3. Change in vitamin D status during follow-up in patients without vitamin D deficiency at the time of initial assay
There were 74 patients who did not have vitamin D deficiency at the time of initial assay. Among them, 17 patients were lost to follow up. The initial mean 25(OH)D level in 57 patients (77%), was 42.53±31.15 ng/mL, but it decreased to 15.77±6.48 ng/mL. There was a significant decline in the serum 25(OH)D level during follow up (-26.76±33.88, P<0.001) (Fig. 1).
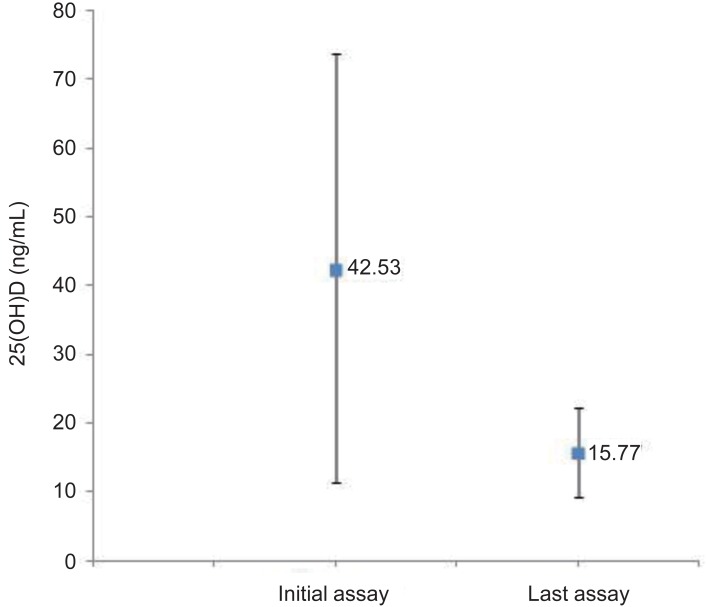
The mean serum 25(OH)D level in patients of the non-deficiency group at the time of initial assay and last assay (P<0.001). 25(OH)D, 25-hydroxy vitamin D3.
During follow-up, only 10 patients (17.5%) did not have vitamin D deficiency and 47 subjects (82.5%) became vitamin D deficient at the last assay. At 2 years of follow-up, 54.4% of patients became vitamin D deficient and at 3 years, 73.7% of patients became deficient (Fig. 2). According to the analysis based on the total medication duration, one-third of the study subjects (n=19, 33.3%) became vitamin D deficient after 3 years of medication, 28 patients (49.1%) after 5 years of medication, and 39 patients (68.4%) by 7 years of medication.

Vitamin D status from nondeficiency to deficiency during follow-up.
The change of serum 25(OH)D levels during follow-up demonstrated a weak negative correlation with the duration of medication (r=-0.283, P=0.033) (Fig. 3). There was a positive correlation between serum 25(OH)D levels and serum phosphorus levels at the time of last assay (r=0.356, P=0.016) (Fig. 4).

Correlation between the change of serum 25(OH)D levels during follow-up and the duration of medication (r=-0.283, P=0.033). 25(OH)D, 25-hydroxy vitamin D3.
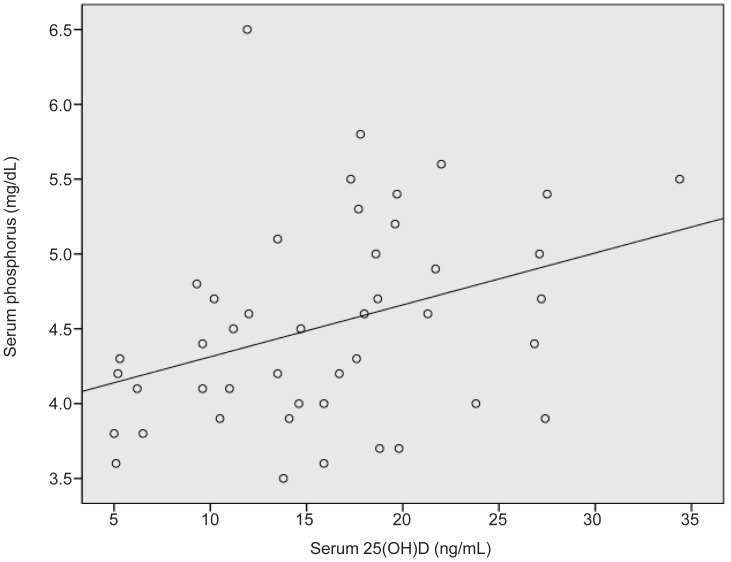
Correlation between serum 25(OH)D levels and serum phosphorus levels at the time of last assay (r=0.356, P=0.016). 25(OH)D, 25-hydroxy vitamin D3.
There were no statistically significant differences in gender, gestational age, birth weight, underlying conditions, ambulation ability, mean serum calcium and phosphorus level, alkaline phosphatase level, height and weight and BMI z-scores, medication type, mean number of medication, and findings on brain MRI between the group with vitamin D deficiency and the group without vitamin D deficiency during follow-up.
4. Comparison between the two groups subdivided according to the substantial changes in serum 25(OH)D level during follow-up
The patients who were followed up were subdivided into two groups according to the presence of substantial decrease in vitamin D level. Substantial decrease in vitamin D level was defined as a decline of more than 15 ng/mL in the serum 25(OH)D level from the initial assay to the last assay. Thirty-two patients (56%) did not show a significant decline in vitamin D level and were classified into group A, and 25 patients (44%) who showed a significant decline were classified into group B (Table 3). The mean change of serum 25(OH)D level was -5.17±5.03 ng/mL in group A compared to -54.4±35.06 ng/mL in group B (P<0.001). Mean duration of medication (7.05±3.89 years vs. 4.7±3.46 years, P=0.012) and mean number of medications (1.84±1.07 vs. 1.28±0.46, P=0.037) were significantly higher in group B. Mean serum phosphorus (4.29±0.61 mg/dL vs. 4.71±0.69 mg/dL, P=0.022) and alkaline phosphatase (160.52±76.83 IU/L vs. 247.4±139.03 IU/L, P=0.028) levels were significantly lower in group B, and there was a more significant decrease in serum phosphorus level (-0.51±0.54 mg/dL vs. 0.05±0.73 mg/dL, P=0.013) in group B. Brain MRI abnormality, abnormal underlying conditions, and nonambulatory status were more frequently present in group B (P<0.05) (Table 3).

Clinical and laboratory data of the 57 subjects without vitamin D deficiency at the initial assay subdivided based on the presence of a substantial decrease in the serum 25(OH)D level during follow-up
There were no statistically significant differences in gender, gestational age, birth weight, season at the time of last assay, age at the time of last assay, mean serum calcium, height and weight and BMI z-scores, and medication type (monotherapy vs. polytherapy; nonenzyme inducing AED vs. enzyme inducing AED) between groups A and B.
In the univariate model, factors associated with an increased risk of substantial decrease in vitamin D level were mean duration of medication, abnormal brain MRI findings, abnormal underlying conditions, nonambulatory status, and mean number of medications, although none of them were statistically significant risk factors associated with a substantial decrease in vitamin D level in the multivariate model (Table 4).

Risk factors associated with a substantial decrease in the serum 25(OH)D level during follow-up
Discussion
This study showed a high prevalence of vitamin D deficiency (62.6%; 124 out of the 198 patients) in a pediatric epilepsy population on antiepileptic drugs. Two previous studies showed a prevalence of vitamin D deficiency in a pediatric epilepsy population of about 22%13) and 25%, respectively14). The reason why the previous two studies showed different prevalence compared to this study might be attributable to the difference in target ethnic group, environmental difference such as the amount of sunshine, and the number of patients included in this study. Higher prevalence of vitamin D deficiency in Korean population compared to that of United States population suggests that the ethnic or environmental differences have significant influence on the prevalence of vitamin D deficiency.
Vitamin D deficiency is defined as a low serum level of 25(OH)D, with insufficient consensus about the cutoff value of 25(OH)D level. Most authors suggest that 25(OH) D concentration <20 ng/mL is an indicator of vitamin D deficiency, and a serum level of 21-29 ng/mL is considered vitamin D insufficient12151617).
In this study, the criterion for vitamin D deficiency was set as a serum level of 25(OH)D<20 ng/mL based on the reference mentioned above.
Several previous studies showed the risk factors for vitamin D deficiency in a pediatric epilepsy population on antiepileptic drugs. In 2008, Nettekoven et al.8) reported that the prevalence of vitamin D deficiency in pediatric epilepsy patients on antiepileptic drugs is high, especially in the group receiving polytherapy. A recent study on vitamin D status in adult patients with epilepsy documented that patients taking enzymeinducing antiepileptic drugs (e.g., carbamazepine, phenobarbital, phenytoin, primidone) had a higher prevalence of vitamin D deficiency compared to the patients who were not taking enzyme-inducing antiepileptic drugs18). Another longitudinal cohort study in children on antiepileptic drugs reported a significant decline in vitamin D level among patients during followup, and showed that longer duration of antiepileptic drugs was associated with a significant decrease in the 25(OH)D level5).
In general, aging was recognized as a risk factor for vitamin D deficiency1). Aging contributes to a decreased concentration of 7-dehydrocholesterol, a precursor of vitamin D3. Obesity is also considered to trigger vitamin D deficiency, of which the lipid solubility results in its deposition in body fat compartments7).
Our study showed significant differences in season at the time of assay, age, serum calcium concentration between the vitamin D deficiency group and vitamin D nondeficiency group. Polytherapy, enzyme inducing antiepileptic drugs and medication duration did not show any significant difference, which might be attributed to the small number of patients included in this study.
The major difference in this study from other studies is that we simultaneously performed a cross-sectional study as well as a cohort study. In this study, most of the patients had vitamin D deficiency during follow-up. Several factors including mean duration of medication, abnormal findings on brain MRI, abnormal underlying conditions, nonambulation, and mean number of medications had a significant influence on substantial change in the serum 25(OH)D level. However, none of the factors was confirmed as a risk factor for vitamin D deficiency or for substantial change in serum 25(OH)D levels in the multivariate model. This might be due to the small number of patients included in the study and relatively short follow-up duration.
Vitamin D deficiency influences the musculoskeletal system, therefore it especially causes growth retardation and rickets in children119). Muscle weakness is also related to vitamin D deficiency2021). Vitamin D also affects various systems other than the musculoskeletal system. Vitamin D deficiency is thought to be associated with cancer22232425), diabetes mellitus262728), multiple sclerosis26), rheumatoid arthritis26), hypertension29), various respiratory diseases such as asthma30), pneumonia31), upper respiratory tract infection32), and psychiatric diseases such as depression33).
This study shows that vitamin D deficiency is common in children with epilepsy, especially in adolescents more than 12 years of age. Moreover, this study emphasizes the importance of monitoring the vitamin D level regularly because most of the pediatric epilepsy patients who showed normal serum vitamin D level at the time of the first assay became vitamin D deficient during follow-up, especially in the presence of longer medication duration, brain MRI abnormality, abnormal underlying conditions, and nonambulatory status.
Acknowledgments
The present research was conducted by the research fund of Dankook University in 2014.
Notes
Conflict of interest: No potential conflict of interest relevant to this article was reported.