

Introduction
Growth failure is a problem for all girls with Turner syndrome (TS), with untreated individuals achieving an average adult stature 20 cm shorter than their peers1). Growth hormone (GH) treatment is now a standard of care for girls with TS2), which ameliorates growth failure and improves final adult height (FAH).
Cochrane database review in 20073) reported that GH doses between 0.3 to 0.375 mg/kg/wk increased short-term growth in girls with TS by approximately 3 cm (2 cm) in the first (second) year of treatment, and that mean FAH in 61 GH treated women was 148 cm compared to 141 cm in 43 untreated women. Despite GH therapy, girls treated with GH are still substantially shorter than other women as adults.
In the literature, factors affecting FAH include young age and bone age (BA) delay at the start of GH treatment, GH dose, duration of GH treatment, maternal X chromosome origin, target height, and good first-year height response to GH treatment4,5,6,7,8). Growth response is known to decrease over the years of GH treatment8,9,10). Good first-year response to GH therapy is important in determining FAH. However, in order to achieve FAH above the third percentile of the general population and height compatible with one's genetic target height, good response to GH needs to be maintained. Increments in GH dose generate better short- and long-term growth response7,8), thus identifying groups at risk of poor GH response and increasing doses accordingly is effective in terms of cost and safety.
Although one study reported that subjects with maternal X chromosome origin (Xm) had greater height gain during GH treatment than those with paternal X chromosome origin (Xp)6), the issue as to whether X-linked imprinting affects the GH response remains controversial. The phenotypic difference between Xp and Xm groups may reflect sexual dimorphism, because 46, XY males have only Xm. However, the role of Y chromosome sequences (Yseq) needs to be considered to explain the sexual dimorphism. To our knowledge, there has not yet been studies comparing GH responses in TS patients with Y chromosome sequences (Xm_Yseq) with 45,Xp or 45,Xm patients.
We analyzed TS patients with 45,X and/or 46,X,mar(Y) karyo-types to evaluate whether parental origin of the intact X chromosome and/or the presence of Yseq affects GH response during 3 years of therapy and plays a role in decreased GH response.
Materials and methods
This study was approved by the Seoul National University Hospital Ethics Committee. Informed consent was obtained from both the parents and children. All patients had confirmed karyotyping of 50 lymphocytes at the time of diagnosis of TS. Fifty-five TS patients (45,X, n=37; 45,X/46,X,+mar, n=18) were enrolled in genetic analyses to detect for Yseq and to determine parental origin of the intact X chromosome. Complete height data at the first, second and third year after start of GH therapy was available for analysis in a total of 33 patients (45,X, n=25; 45,X/46,X,+mar(Y), n=8). No patients took oral estrogen during these 3 years of GH therapy.
1. Analysis for detection of Y chromosome sequences
Polymerase chain reaction (PCR) using eight primers (PABY, SRY, ZFY, TSPY, DYS 270, DYS 280, DYS 209, and DYZ1) was performed to detect Yseq in TS subjects with cytogenetically proven (SRY positive) or unproven marker chromosome (45,X/46,X,+mar) and those subjects with 45, X karyotype. Female laboratory personnel who did not know the clinical characteristics of the enrolled TS patients performed all experiments to minimize the risk of producing false-positive results. Primers that amplify the CYP17A1 gene were used as an internal control for conventional PCR amplification of Y-linked markers to avoid false-negative results.
There were 8 patients enrolled in the study with the 45,X/46,X, mar(Y) karyotype, who either underwent gonadectomies before commencing GH treatment or did not show signs of virilisation throughout the duration of GH therapy. They had normal female external genitalia without signs of virilisation or spontaneous puberty throughout the GH treatment. All 8 patients were positive for PABY, SRY, ZFY, TSPY, and DYS 270 loci in analysis of the Y chromosome sequence, thus it was inferred that all patients contained the short arm and centromere (DYS 270) portion of the Y chromosome.
2. Assignment of parental origin of intact X chromosome
Confirmation of the parental origin of the intact X chromosome was analyzed by comparing the patient and parental DNA using nine highly polymorphic X chromosome microsatellites (DXS 1060, DXS 8051, DXS 1228, DXS 1214, DXS 986, DXS 990, DXS 1001, DXS 104, and DXS 8043), which were derived from the ABI PRISM Linkage Mapping Set MD-10 (Applied Biosystems Inc., Foster City, CA, USA). Highly polymorphic microsatellite markers were selected for their high percentage of heterozygosity (70.5%-86%), their allele number, and their location on both Xp and Xq based on a Korean reference11). PCR amplification was performed under the following conditions: 95Ōäā for 2 minutes, then 35 cycles at 95Ōäā for 20 seconds, 58Ōäā for 40 seconds, 72Ōäā for 30 seconds, and 72Ōäā for 45 minutes11). None of the 45,X patients had hidden X fragments detected using X chromosome microsatellites. All 8 TS patients with 45,X/46,X,+mar(Y) were confirmed to have a Xm. Finally, those 25 patients with 45,X (Xp, n=10; Xm, n=15) and 8 patients with 45,X/46,X,+mar(Y) (Xm_Yseq) with complete height data were included in this study for analysis of height response to GH therapy.
3. The first-, second-, and third-year response of TS patients receiving GH therapy
The first-, second-, and third-year response to GH therapy was measured as a change in height z-score (Z_Ht) according to two different reference populations: TS specific height values as described by Lyon et al. (Z_Ht_Lyon)12) and the 2007 Korean reference height values (Z_Ht_07Kor)13). Given that there are no reliable Korean TS reference height values, the data of Lyon et al.12) was used for reference. Height (cm) was measured twice with a Harpenden stadiometer (Holtain Ltd., Crymmynch, Wales, UK) to one decimal place. The 2007 Korean reference height values13) were used for derivation of the midparental height z-score (Z_MPH) and body mass index z-score (Z_BMI). The proportion of poor responders to GH therapy, defined as those with a change in Z_Ht_Lyon (Ō¢│Z_Ht_Lyon) <0.1, was calculated. The percentage of patients below the third percentile of the general population (Z_Ht_07Kor<-1.88) was calculated. BA was assessed using the Greulich and Pyle method. Factors affecting growth response were investigated, including mean GH dose during each year of treatment (IU/kg/wk), difference in BA and chronologic age (BA delay), Z_MPH, and Z_Ht at the start of GH (baseline) and after the first, second and third years of GH treatment. The first-, second-, and third-year change in Z_Ht (first, second, and third year Ō¢│Z_Ht_Lyon and Ō¢│Z_Ht_07Kor) was calculated, respectively.
4. Statistical analysis
Statistical analyses were performed using PASW Statistics ver. 18.0 (SPSS Inc., Chicago, IL, USA). All continuous variables are described as mean┬▒standard deviation. The differences in the means of nonnormally distributed variables (GH dose) were tested by Kruskal-Wallis test. The other dependent variable was normally distributed for each 3 groups being compared. The differences in the means of continuous variables with homogenous variance between the 3 groups were tested by analysis of variance (ANOVA), and Welch's ANOVA was used for other variable with heterogeneous variance. The difference in the means of variables within 2 subsets was analyzed using the Bonferroni method with P set at 0.025. The chi-square test for trend was used to analyze the relationship between the 3 groups.
The significance of the difference in baseline Z_Ht between the 3 groups (Xp, Xm, and Xm_Yseq group) was tested using analysis of covariance (ANCOVA), after controlling for the BA delay and Z_MPH. Heteroscedasticity-consistent standard errors14) was used to correct for heteroscedasticity in the ANCOVA. To test the influence of parental origin of intact X chromosome and/or Yseq across time points (baseline, 1 year, 2 years, and 3 years of GH therapy), we performed a repeated-measures analysis of variance with time as the within group factor and the 3 groups as the between group factor. In the between group analysis, the means of Z_Ht_Lyon for the 3 groups are compared within each time points. In the within-group analysis, the mean for each time points can be compared with the mean for each of the other time periods. To adjust for baseline Z_Ht_Lyon, age at the start of GH, BA delay, mean GH dose for 3 years, Z_MPH, a series of repeated measures analysis of covariance models was used.
Possible factors significantly related to the third-year Ō¢│Z_Ht_Lyon in the simple linear regression were finally included in the multivariate regression model. Parental origin of intact X chromosome and/or Yseq (Xp/Xm/Xm_Yseq group), chronologic age (CA), Z_Ht_Lyon, and BA delay after 2 years of GH therapy, Z_MPH, third-year GH dose, the change in GH dosage between the second and third-years of treatment (Ō¢│second year and third-year GH dose), first-year Ō¢│Z_Ht_Lyon, and second-year Ō¢│Z_Ht_Lyon were selected as possible factors. Test for interaction was also used to analyze the modifying effect of the second-year Ō¢│Z_Ht_Lyon on the association between Ō¢│second year and third-year GH dose and the third-year Ō¢│Z_Ht_Lyon, because the effect of the third-year Ō¢│Z_Ht_Lyon might vary depending on the second-year Ō¢│Z_Ht_Lyon. Significance was defined as P<0.05.
Results
The mean baseline Z_Ht at the start of GH therapy was 1.26┬▒1.04 (Z_Ht_Lyon) and -2.3┬▒0.81 (Z_Ht_07Kor). The CA was 8.5┬▒3.1 years and the BA was 7.5┬▒3.2 years. The patients were started on GH treatments at a dose of 0.97┬▒0.16 U/kg/wk (range, 0.47-1.4). The average GH dosage for all 3 years of treatment was 0.94┬▒0.15 U/kg/wk (range, 0.54-1.34).
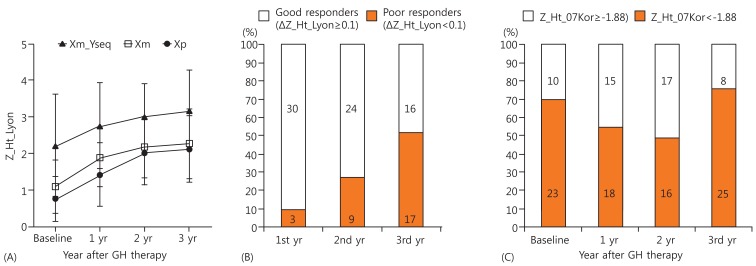
When baseline characteristics of the 3 groups (Xp, Xm, and, Xm_Yseq group) were analyzed, there were no differences in baseline CA or BA. The significant difference in baseline Z_Ht_Lyon between the 3 groups was found (0.75┬▒0.61 vs. 1.08┬▒0.74 vs. 2.21┬▒1.39, P=0.047 by Welch's ANOVA, Table 1). While there was no significant difference in baseline Z_Ht_Lyon between the Xp and Xm groups, the Xm_Yseq group had a higher baseline Z_Ht_Lyon than the Xm group, after adjusting for BA delay and Z_MPH (P=0.04) (Fig. 1).
Z_Ht_Lyon significantly increased during 3 years of GH treatment (P<0.001) (Fig. 2A, Table 2). While Z_Ht_Lyon significantly increased by 0.69 in the first year (P<0.001) and by 0.38 in the second year of GH treatment (P=0.003), the third-year increase of 0.11 was not statistically significant (P=0.99). The average dose (IU/kg/wk) of GH was 0.97┬▒0.16 (0.5-1.4), 0.92┬▒0.17 (0.48-1.27), and 0.93┬▒0.17 (0.64-1.35) during the first, second and third years of treatment, respectively. However, there was no difference between the 3 groups (Xp, Xm, and Xm_Yseq) as to the overall pattern of change in Z_Ht_Lyon with GH treatment (P=0.536) (Fig. 2A, Table 2). The differences in the mean Z_Ht_Lyon values during the 3 years (Xp vs. Xm_Yseq, P=0.004; Xm vs. Xm_Yseq, P=0.013) were no longer significant, after adjusting for baseline Z_Ht_Lyon, CA at the start of GH, BA delay, GH dose and Z_MPH (P=0.715) (Fig. 2A).
The proportion of poor responders (Ō¢│Z_Ht_Lyon<0.1) increased progressively from the first, second and third years of treatment by 9.1%, 27.3%, and 51.5% respectively (Fig. 2B). The percentage of short patients (Z_Ht_07Kor<-1.88) declined successively from 69.7% at the time of GH commencement to 54.6% and 48.4% during the first and second years, but increased to 76.7% during the third year of treatment (Fig. 2C). These 25 short patients (76.7%) after 3 years of GH treatment included 8 (53.3%) of 15 patients who were consistently good responders for all 3 years, 12 of 13 patients (92.3%) who became poor responders in the third year of treatment, and all 5 patients (100%) who had remained poor responders for all 3 years (P=0.011, chi-square test for trend).
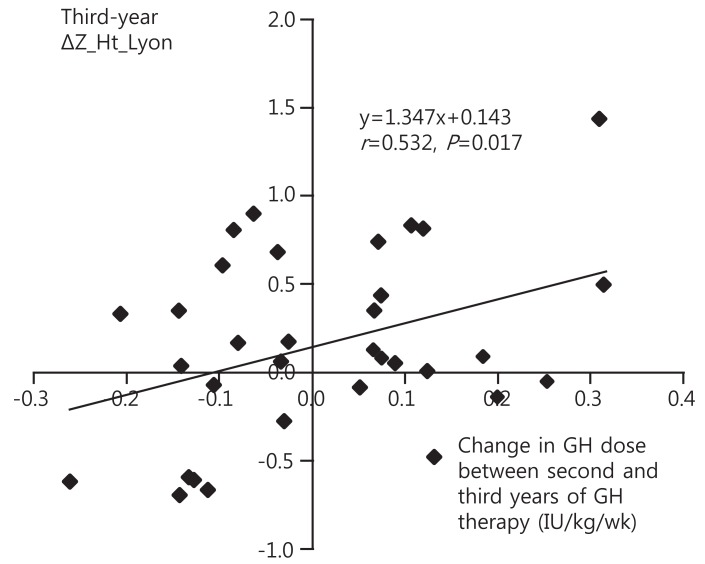
To identify groups at risk of poor GH response, factors affecting the third year response to GH (third year Ō¢│Z_Ht_Lyon) were analyzed. In simple linear regression analysis, the third year Ō¢│Z_Ht_Lyon was negatively related to the second year Ō¢│Z_Ht_Lyon (P=0.040), and positively associated with the Ō¢│second and third year GH dose (P=0.011), respectively (Table 3). However, the origin of the intact X and/or the presence of Yseq did not have a significant effect on the third year Ō¢│Z_Ht_Lyon (Xm vs. Xp, P=0.98; Xm vs. Xm_Yseq, P=0.69) (Table 3). No significant correlation between the second year Ō¢│Z_Ht_Lyon and the Ō¢│second year and third-year GH dose was observed (P=0.51). The modifying effect of the second-year Ō¢│Z_Ht_Lyon on the association of Ō¢│second year and third-year GH dose with the third-year Ō¢│Z_Ht_Lyon was not significant (P for interaction=0.15). In multivariate linear regression analysis, the only factor found to contribute to the third-year Ō¢│Z_Ht_Lyon was the Ō¢│second year and third-year GH dose (P=0.017) (Fig. 3).
Discussion
The mean baseline Z_Ht did not differ according to Xp or Xm origin, however the mean baseline Z_Ht was higher in the Xm_Yseq group than in Xm group, after adjusting for BA delay and Z_MPH. When this difference in baseline Z_Ht was accounted for, there was no difference between the 3 groups in the response to 3 years of GH therapy. The height response to GH therapy decreased progressively each year, such that the increase in Z_Ht was not significant during the third year of therapy. This third-year decrease in treatment response was unaffected by parental origin of X chromosome and/or presence of Yseq. The response to GH treatment during the third year was positively correlated with the increase in GH dose from the second to third year.
In contrast to several autosomal genes identified in humans and X-linked imprinted genes in mice, an X-linked imprinted gene has not been identified in humans. Phenotypic differences between TS patients with Xm and those with Xp suggest the presence of X-linked imprinted genes in humans. Zinn et al.15) suggested that a stature-determining critical region can be mapped between Xp22.1 and Xp11.2, which is located more proximally than short stature homeobox (SHOX) gene. Candidate imprinted regions on the X chromosome may be located in genes showing extensively variable expression between individual inactivated X chromosomes16) rather than in pseudoautosomal regions. Previous studies6,17) have been published on the contribution of the parental origin of the intact X chromosome to the response to GH treatment. Hamelin et al.6) first reported a significantly greater gain in height during a 5- to 6-year period of GH therapy in Xm than in Xp TS females. A report in patients with Klinefelter syndrome showed that growth parameters were greater in an extra Xp group than in an extra Xm group18). However, the imprinting effect in patients with TS or Klinefelter syndrome has not been replicated convincingly, and additional studies are needed to confirm or exclude X chromosomal imprinting. In our study, we included only 45,X patients without hidden X or Y chromosome sequences (pure Xp or Xm) to exclude the effect of different karyotype on the growth of TS patients. Our results show no difference in baseline Z_Ht of Xp and Xm groups as well as no differences in the response to 3 years of GH therapy.
The phenotypic difference between Xp, Xm and Xm_Yseq groups may reflect sexual dimorphism. There have not been previous studies that compared phenotypic differences in 3 groups of TS patients. In our study, changes in height of the 3 groups without missing data during 3 years of GH therapy were analyzed. Although Xm_Yseq patients had greater baseline Z_Ht than Xm and Xp patients, there was no significant difference in the response to GH therapy. Despite the fact that height is a multifactorial trait affected by genetic and environmental factors, the greater baseline height of Xm_Yseq over Xm suggests that the Y chromosome harbors genes that affect height. This hypothesis is also supported by the observations that XY females are generally taller than XX females, that XY males are taller than XX males19), and that patients with pure XX or XY gonadal dysgenesis show height differences despite having gonadal steroid deficiency20). Correlations between breakpoints on Yq and the height of respective patients assigned the growth controlling gene on the Y chromosome (GCY) locus to the pericentromeric region of Yq1121). Kirsch et al.22) confirmed the proximal interval between markers DYZ3 and DYS11 as the GCY critical interval on Yq using detailed Fluorescence in situ hybridization and high density sequence-tagged sites (STS) analysis. DYS 11 is located between DYS 270 and DYS 280, which STS were included in our analysis. The marker chromosome of the Xm_Yseq patients in this study contained the Y chromosome short arm (Yp) and the DYS 270 locus, making it likely that the GCY critical interval is also included. Previous reports indicate GH-deficient men are more responsive to GH therapy than are women23). Thangavel and Shapiro24) proposed that the cellular actions of GH, normally mediated by activation of the Jak2/Stat5B pathway, are suppressed in female cells compared with male cells. However, there was no difference in response to 3 years of GH therapy between the Xp, Xm and Xm_Yseq groups when adjusted for differences in baseline Z_Ht in our study.
When the response to GH therapy during the third year was assessed, there was no significant increase in Z_Ht during this period with more than 50% of patients being poor responders. The percentage of short patients smaller than the third percentile (Z_Ht_07Kor<-1.88) increased from 69.6% at the commencement of GH therapy to 76.7% during the third year. Starting in the year 2000, the insurance coverage guidelines of the Korean Ministry of Health and Welfare recommended GH doses of 1.0 U/kg/wk up to a height of 150 cm. An additional provision to increase this dosage to a maximum of 1.4 U/kg/wk was added in the year 2010 for those patients with poor response up to a height of 150 cm. The patients in this study received GH according to the guidelines before 2010, so there was a restriction in the range of GH increments. Although there was a general tendency to increase the GH dosage with poor response during the previous year, the incremental range was too small to show a significant correlation between previous response to GH therapy and next year GH dose increment. The response to GH therapy progressively declined so that there was no significant response during the third year of therapy. The decrease in response did not differ between Xp, Xm, and Xm_Yseq groups. The change in GH dosage from the second to third year of treatment was the only significant predictor influencing the third-year growth response. A recent study proposed that the dose increments in the second and third years of treatment in patients with poor response during the previous year attenuated the normal decline in GH response8). A study of step-up dosage regimes published by van Pareren et al.10) showed that dose increments had a significant effect on final height, although the effect was discernible only after 4-7 years. GH dosage needs to be increased at the third year without regard to the response during the previous year or parental origin of X chromosome and/or Yseq.
This study included only those TS patients with pure 45,X and 45,X/46,X,+mar(Y) karyotypes who had complete height data throughout 3 years of GH therapy and is therefore limited by the small sample size. Additionally, the effect of GH therapy on FAH was not included in this study. Once patients reached a height of 150 cm, Korean national insurance guidelines did not provide GH coverage. GH treatments were usually discontinued even though FAH was not attained, making analysis of the GH response in determining FAH difficult. Despite limitations, this is the first study to assess three year GH response in TS patients including pure Xp, pure Xm homogenous subjects and in those with Xm_Yseq karyotypes.
In conclusion, there was no evidence of X-linked imprinted genes and/or Yseq affecting height response to three years of GH therapy. Without regard to the parental origin of intact X chromosome and/or presence of Yseq and GH response during the previous year, increasing GH dosages may help attenuate the decrease of the third year response to GH therapy in TS patients with 45,X and/or 46,X/mar(Y).