Combined aerobic and resistance exercise is effective for achieving weight loss and reducing cardiovascular risk factors without deteriorating bone health in obese young adults
Article information
Abstract
Purpose
Weight loss reduces cardiovascular risk factors in the obese. However, weight reduction through diet negatively affects long-term bone health. The aim of study was to determine the ability of combined aerobic and resistance exercise (CE) to reduce weight and cardiovascular risk without diminishing bone health.
Methods
Twenty-five young adults participated in an 8-week weight loss CE program. Subjects were allocated to an obese group or a control group by body mass index (BMI). Body weight, BMI, body composition, and bone mineral density (BMD) of the lumbar spine and total hip were measured before and after the CE trial. Serum levels of metabolic markers, including adipokines and bone markers, were also evaluated.
Results
Weight loss was evident in the obese group after the 8 weeks CE trial. Fat mass was significantly reduced in both groups. Fasting insulin, homeostatic model assessment-insulin resistance (HOMA-IR), leptin and aminotransferases level were significantly reduced from baseline only in the obese group. High density lipoprotein cholesterol increased in both groups. Hip BMD increased in the obese group. In all study subjects, BMI changes were correlated with HOMA-IR, leptin, and HDL changes. BMI decreases were correlated with lumbar spine BMD increases, lumbar spine BMD increases were positively correlated with osteocalcin changes, and lumbar spine bone mineral content increases were correlated negatively with C-terminal telopeptide of type 1 collagen changes.
Conclusion
These findings suggest that CE provides effective weight loss and improves cardiovascular risk factors without diminishing BMD. Furthermore, they indicate that lumbar spine BMD might be maintained by increasing bone formation and decreasing bone resorption.
Introduction
Obesity is the common nutritional disorder in the world. Furthermore, the prevalence of obesity is rapidly increasing worldwide, and it now affects both the developed and developing world1,2). Obesity increases the risk of many physical and mental conditions, for example, it contributes to the development of cardiovascular disease, metabolic syndrome, type 2 diabetes, hypertension, osteoarthritis, and cancer3). Furthermore, obesity is a major preventable cause of death and on average, obesity reduces life expectancy by six to seven years4).
The commonly used treatment for obesity involves dieting and physical exercise5). However, the success rates of long-term weight loss through diet and exercise, with appropriate lifestyle changes, are only 2-20%6). Weight loss improves metabolic fitness and reduces the morbidity and mortality associated with overweight and obesity7), but weight reduction through diet also reduces bone mineral density (BMD) and elevates serum and urinary markers of bone resorption8). Furthermore, chronic dieting has been associated with reduced bone mineral content (BMC) and repeated cycles of weight loss and regains increase the risk of bone fracture9). Thus, weight loss through diet may negatively affect long-term bone health.
Regular physical activity is often incorporated into weight-loss and facilitated fat loss programs, and is known to preserve lean body mass. However, there is some debate regarding the effects of exercise on bone health. High-impact physical activities and resistance training have been reported to increase BMD10), whereas aerobic exercises, and some impact exercises, incorporated into a weight loss program were found not to increase BMD11). Furthermore, in one study, weight loss was found to outweigh the effects of exercise on bone metabolism12).
Thus, the purpose of this study was to evaluate the effects of a commonly recommended combined aerobic and resistance exercise (CE) weight loss program composed of aerobic and resistance exercises. We hypothesized that the CE program would reduce obesity and obesity-related complication without detrimentally affecting bone metabolism. To do this, we conducted a 2-month CE program and examined bone mineral densities and body compositions in obese young subjects. In addition, we examined metabolic parameters, such as, bone markers and adipokines, before and after intervention.
Materials and methods
1. Subjects
Clinical characteristics of the study subjects are listed in Table 1. Twenty-five volunteer healthy university students of mean age 23.9±0.3 years participated in this study. Twelve subjects were male and 13 were female. The selection criteria adopted were; (1) no history of metabolic disease, such as, diabetes, hypertension, or any other chronic disease, (2) no use of medication capable of influencing weight or the affects of exercise, and (3) no history of regular exercise during the previous 2 years. Subjects were assig-ned to either an obese group (n=16) or a control group (n=9) by BMI. Obesity was defined as a body mass index (BMI) greater than 25 kg/m2, according to the guidelines issued by the Korean Society of Obesity13). The experimental protocol was approved by the Institutional Review Board of Chosun University Hospital. All subjects provided written informed consent before taking part in this study.

Clinical characteristic of the obese and control groups at preintervention
2. Exercise program
Members of both study groups performed the same quantity of exercise (approximately one and a half hours, 3 times per week for 8 weeks. The CE program was composed of stretching, aerobic, and resistance exercises14). After stretching, each subject began exercising at 60-70% of heart rate reserve (HRR) by walking along a track. During each session, each subject performed stair climbing, stationary cycling, and resistance exercises (lat pull-downs, abdominal exercises, leg curls, leg extensions, and bicep curls; Each exercise was repeated 12 times per exercise set, for two sets) at 60-70% of HRR (this included a 10 minutes warm-up and a 10 minutes cool-down period).
3. Anthropometric measurements
Anthropometric measurements were taken before and after the 8-week CE program. Weight was measured to the nearest 0.1 kg on an electronic scale (150A, CAS, Seoul, Korea) and height was measured to the nearest 0.1 cm using a Harpenden stadiometer. The waist circumference was measured at the midpoint between the lowest rib and the iliac crest, as defined by the World Health Organization.
The measurements were duplicated, and average values were used in the analysis. The BMI was calculated by dividing weight by height squared (kg/m2). Body composition measures, that is, fat-free mass (FFM), fat mass (FM), and body fat percent (%BF), were obtained by bioelectrical impedance analysis (MF-BIA8; InBody 2.0, Biospace Co., Seoul, Korea) after at least 3 hours of fasting and voiding.
4. BMD and BMC measurements
BMD and BMC of the lumbar spine, total hip, femur neck, and trochanter were measured serially using a QDR-4500 X-ray Bone Densitometer running software ver. 9.03 (Hologic, Boston, MA, USA). A trained technician performed the measurements according to manufacturers' instructions. The scan speed of each measurement was 4 mm/sec and the step distance was 5 mm.
5. Blood sample analysis
Blood samples were obtained from all subjects after a 10 hours overnight fast. After collection, samples were centrifuged at 48℃ and plasma- and serum-containing tubes were stored at -70℃ until analysis. Plasma glucose, serum cholesterol, triglyceride (TG), and high density lipoprotein cholesterol (HDL-C) analyses were performed using a Hitachi 7150 Autoanalyzer (Hitachi Ltd., Tokyo, Japan). Low-density lipoprotein cholesterol (LDL-C) values were calculated, using the Friedewald formula using serum cholesterol, HDL-C, and TG values.
Serum insulin levels were determined using a radioimmunoassay (DiaSorin, Saluggia, Italy). The assay sensitivity was <4 IU/mL, and its within-assay and between-assay coefficients of variation were 6.6% and 10.6%, 5.5% and 6.2%, and 10.8% and 9.7%, respectively, for insulin concentrations of 24.1 IU/mL, 73.6 IU/mL, and 130.8 IU/mL. Insulin resistance was estimated using homeostatic model assessment-insulin resistance (HOMA-IR), and was calculated as fasting glucose (mmol/L)×fasting insulin (µU/L)÷22.5. Leptin was measured using a radioimmunoassay (Linco Research Inc., St. Charles, MO, USA); the assay sensitivity was 1.0 ng/mL, and its intra-assay and inter-assay coefficients of variation were 3.6% and 6.2%, 1.8% and 9.3%, and 6.9% and 9.3%, respectively, for sample concentrations of 1.5 ng/mL, 3 ng/mL, and 7.5 ng/mL, respectively. Adiponectin was also measured by radioimmunoassay (Linco Research Inc.); assay sensitivity was 1.0 ng/mL, and its intra-assay and inter-assay coefficients of variation were 3.6% and 6.2%, 1.8% and 9.3%, and 6.9% and 9.3%, respectively, for sample concentrations of 1.5 µg/mL, 3 µg/mL, and 7.5 µg/mL, respectively. Osteocalcin was also measured by radioimmunoassay (B · R · A · H · M · S GmbH, Hennigsdorf, Germany); assay sensitivity was 0.54 ng/mL, and intra-assay and inter-assay coefficients of variation were 11.5% and 2.4%, 4.18% and 13.0%, and 7.7% and 5.6%, respectively, for sample concentrations of 2.6 ng/mL, 8.4 ng/mL, and 17.0 ng/mL, and 2.3 ng/mL, 6.5 ng/mL, 23.3 ng/mL, respectively. C-terminal telopeptide of type 1 collagen (ICTP) was also measured by radioimmunoassay (Orion Diagnostica, Espoo, Finland); assay sensitivity was 0.4 µg/L, and intra-assay and inter-assay coefficients of variation were 4.8% and 3.5%, 6.3% and 1.8%, 5.6% and 7.6%, and 9.0% and 6.4%, respectively, for sample concentrations of 6.8 µg/L, 3.7 µg/L, 14.7 µg/L, and 24.5 µg/L, and 5.5 µg/L, 8.9 µg/L, 21.3 µg/L, and 17.3 µg/L, respectively. All analyses were performed in duplicate.
6. Statistical analyses
All anthropometric, BMD, body composition, biochemical bone marker, and adipokines values are expressed as mean±standard deviations. The effects of exercise on each variable such as weight, BMI, FFM, FM, %BF, waist-hip ratio, fasting plasma glucose, insulin, HOMA-IR, leptin, adiponectin, aspartate aminotransferase (AST), alanine aminotransferase (ALT), total cholesterol, TG, HDL-C, and LDL-C were evaluated using the paired t-test. Correlation analysis was performed using Spearman's Rank Correlation. All statistical analyses were performed using SPSS ver. 12.0 (SPSS Inc., Chicago, IL, USA). Statistical significance was accepted for P-value of <0.05.
Results
1. Effects of the exercise program on anthropometric and metabolic parameters in the obese and control groups
Weight losses from baseline to follow-up were; obese group, 2.7 kg (3.1%); control group, 0.9 kg (1.4%). FM was significantly lower in both groups at follow-up (obese group, 1.7 kg [6.2%]; control group, 1.0 kg [5.9%]), whereas FFM (lean mass) was not reduced (obese group, -1.5%; control group, 0.0%).
Fasting insulin levels and HOMA-IR were significantly lower at follow-up in the obese group. As a result, fasting insulin levels were similar at follow-up in the two groups. Leptin levels were significantly lower at follow-up only in the obese group, but adiponectin levels did not significantly change in either group. Total cholesterol, TG, and LDL-C did not showed a significant change in either group, except HDL-C, which increased from 47.4±8.8 to 49.9±8.9 mg/dL in the obese group. Serum aminotransferases (AST, ALT) levels decreased in the obese group only (Table 2).

Effects of the exercise program on anthropometric and metabolic parameters in the obese and control groups
2. Effects of the exercise program on BMD and BMCs in the obese and control groups
In the two groups, BMD did not decrease in any of the regions of interest (lumbar spine, total hip, and femoral neck). However, total hip BMD increased in the obese group (P <0.05). BMCs of the regions of interest showed a slight increasing tendency in the obese group. BMC of total hip showed a significant increase in the obese group (P <0.05) (Table 3).
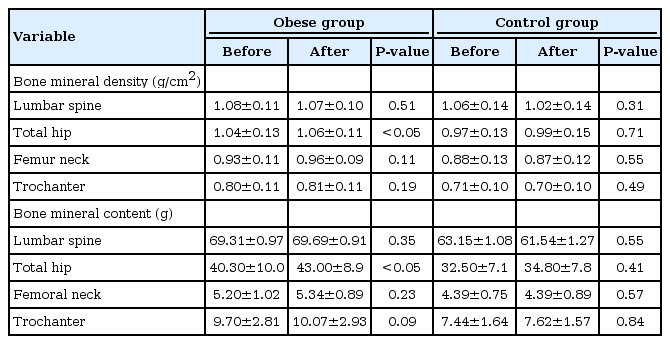
Effects of the exercise program on bone mineral density and bone mineral contents in the obese and control groups
In the 25 study subjects, BMIs were found to be correlated with insulin levels, HOMA-IR (r=0.516, P <0.01), leptin levels (r=0.440, P <0.05), and HDL levels (r=-0.429, P <0.05) at baseline. Furthermore, BMI was correlated positively with total hip BMD (r=0.491, P <0.05) and with ICTP (r=0.503, P <0.01) before the CE exercise program.
After the CE exercise program, BMI changes were correlated with HOMA-IR changes (r=0.480, P <0.05), and with leptin (r=0.510, P <0.01), and HDL-C levels (r=-0.429, P <0.05) at baseline. Weight losses and BMI decreases were correlated with lumbar spine BMD increase (r=-0.467, P <0.05). Furthermore, lumbar spine BMD increases were correlated positively with osteocalcin changes (r=0.538, P <0.05), and negatively with ICTP changes (r=0.529, P <0.05). However, total hip BMDs were not correlated with BMI changes, osteocalcin changes, or ICTP changes. Baseline adiponectin levels and adiponectin changes were not found to be correlated with any variable.
Discussion
The objective of this study was to determine whether CE could influence factors known to be associated with obesity-related complications without detrimentally affecting bone metabolism. We found that CE reduced weight, especially FM in obese subjects. Furthermore, weight loss was associated with a serum insulin level decrease, HOMA-IR improvement, a leptin level decrease, and reductions in aminotransferase (AST, ALT) levels in the obese group. However, CE did not affect FFM or BMD. In addition, total hip BMD and BMC were increased by CE in the obese group, and the lumbar spine BMD change induced by CE was found to be positively correlated with osteocalcin changes and lumbar spine BMC changes and negatively correlated with ICTP changes.
In this study, the CE program, which did not involve diet intervention, effectively improved body compositions, insulin sensitivities, adipokine levels, and aminotransferases levels in the obese group. Although, magnitude of weight loss achievable by exercise without caloric restriction is small and usually ranges from 2 to 7 kg, regular exercises decreases FM and spares FFM, as was observed in this study. Exercise confers significant health benefits to the overweight and obese, and improves plasma lipoprotein status, particular HDL and aminotransferases, which is known to decrease the risk of coronary heart disease and fatty liver15,16).
Adiponectin is an adipose-derived peptide that plays an important role in glucose and lipid homeostasis both directly and as a modulator of insulin sensitivity. Increases in plasma adiponectin levels were observed in overweight and obese individuals who lost weight during their exercise programs17). However, our 8-week CE did not change serum adiponectin levels, as has been reported in similar studies18,19).
In the present study, the CE program effectively reduced weights without diminishing bone densities and reducing bone metabolism. A previous study showed that weight loss improves metabolic complications related to obesity, but weight reduction also reduces bone mass and increase the risk of bone fracture7,9). However, weight reductions achieved by CE increased total hip BMDs and maintained lumbar spine BMDs. Recently, Villareal et al.20), showed that adding exercise prevented bone mass loss in obese older adults in 1-year randomized controlled trial. In Villareal et al.20)'s trial, diet only and diet plus exercise reduced body weights by about 10% versus an exercise only group and a control group. However, lean body mass and BMD at the hip reduced less in the diet plus exercise group than in the diet group (-1% vs. -3%). Their exercise-training program consisted of aerobic exercises and resistance training of 90 minutes duration and was similar to the CE program. The beneficial effects on BMD of combined aerobic and resistance training exercise has been described in premenopausal and post menopausal women with or without significant weight loss21,22). In another study, weight loss via diet induced bone loss by decreasing mechanical stress on the weight-bearing skeleton23). However, exercise increases mechanical stress on the weight-bearing skeleton, and is believed to act on the skeleton via muscles, by causing skeleton strains that are perceived by bone cells as osteogenic effect24).
Interesting finding was that weight reductions correlated with lumbar spine BMD increases. Furthermore, lumbar spine BMD changes were found to be positively correlated with osteocalcin changes and negatively with ICTP changes. Osteocalcin is secreted only by osteoblasts and is thought to play a role in bone formation. Furthermore, osteocalcin has been reported to increase with weight loss with or without weight-bearing exercise in overweight premenopausal women, and to increase much more during exercise-induced weight loss than during caloric restriction-induced weight loss in parallel with total hip BMD increases12,25). It has also been reported that an uncoupled increased concentration of bone formation markers, such as, bone alkaline phosphatase (ALP) indicates an increased bone formation rate and an increase in BMD. Lester et al.26), found that 8 weeks of combined resistance and aerobic training and resistance training alone stimulated increases in bone formation markers, such as, bone ALP and osteocalcin.
ICTP is related to bone turnover, is cleaved by osteoclasts during bone resorption, and its serum levels are proportional to osteoclastic activity. In the present study, ICTP changes were found to be negatively correlated with lumbar spine BMC changes, which suggest CE might protect against bone loss by increasing osteoblast activity and decreasing osteoclast activity despite weight loss. However, bone resorption responses were less clear in other weight loss targeted exercise interventions. Ashizawa et al.27) reported significant decreases in bone resorption markers (cross-linked N-telopeptide of type-1 collagen) following of resistance training exercise. However, Fujimura et al.28) reported no significant changes in a marker of bone resorption (ICTP) but significant increases in markers of bone formation (serum osteocalcin) following 4 months of resistance training.
Some limitations of this study should be acknowledged. First, our sample size was small, and most of the subjects in the obese group were male. Thus, the study was not sufficiently powered to determine differences in outcomes between sexes. Nonetheless, the effects of the CE program were more obvious in the obese group with respect to weight loss and metabolic parameter improvements. Second, only a total hip BMD increase was noted in the obese group, although an increasing tendency was observed in each region of interest. Furthermore, BMI decreases were found to be correlated with lumbar spine BMD increases. Because BMD change evaluations often require study for at least a 1 year, in the present study, bone markers were used to evaluate interventions effects on bone remodeling and mineralization.
Summarizing, this study shows that CE reduced FM and obesity-related metabolic complications and improved total hip BMD, especially in obese subjects. The study also shows that lumbar spine BMD and BMC were maintained in CE induced weight loss. Although mean osteocalcin level decrease after CE, subject who showed higher weight loss also showed relatively high osteocalcin level compared with subject with less weight loss. Therefore, our results suggest that regular CE should be viewed as a component of weight loss programs to offset the adverse effects of weight loss on bone metabolism. Furthermore, our finding regarding of bone marker change in regards of bone density is novel, and requires further evaluation in other exercise programs and in different ages and ethnicities.
Notes
No potential conflict of interest relevant to this article was reported.