Basal luteinizing hormone and follicular stimulating hormone: is it sufficient for the diagnosis of precocious puberty in girls?
Article information
Abstract
Purpose
A gonadotropin-releasing hormone stimulation test (GnRHST) is the gold standard in diagnosing central precocious puberty (CPP). The aim of this study was to investigate the diagnostic accuracy of basal gonadotropin levels for girls with suspected precocious puberty and to evaluate the factors affecting positive results of the GnRHST.
Methods
Korean girls with early pubertal development who visited the clinic during 2010-2012 were included. Auxological and biochemical tests were evaluated and a standard GnRHST was performed. A peak luteinizing hormone (LH) level of ≥5 IU/L was considered a positive response during the GnRHST.
Results
A total of 336 girls were included. The positive responses were observed in 241 girls (71.7%), and negative responses were found in 95 girls (28.3%). In the logistic regression analysis, the coefficient of the basal LH and basal LH/follicular stimulating hormone (FSH) ratio was 4.23 (P<0.001) and 21.28 (P<0.001), respectively. Receiver operating characteristic analysis showed that the basal LH/FSH ratio is a better predictor of the pubertal result after the GnRHST than the basal LH (area under the curve was 0.745 and 0.740, respectively; P=0.027). Among 189 girls with a basal LH of <0.1 IU/L, 105 (55.6%) had positive responses.
Conclusion
An elevated level of the basal LH and basal LH/FSH ratio was a significant predicting factor of positive responses during the GnRHST. However a GnRHST was still necessary for diagnostic confirmation of CPP because more than half of the girls with a basal LH level below the detection limit revealed to have CPP.
Introduction
Central precocious puberty (CPP) is caused by premature sequential activation of the hypothalamic-pituitary-ovarian (HPO) axis1,2). In girls, precocious puberty is defined as the development of secondary sexual characteristics before 8 years of age3). Precocious puberty in girls can lead to a decreased final adult height and psychosocial problems4,5).
For demonstration of the early activation of the HPO axis in girls with pubertal development, the gold standard for laboratory confirmation of CPP is the maximal luteinizing hormone (LH) level after gonadotropin-releasing hormone (GnRH) stimulation6-8). However, the GnRH stimulation test (GnRHST) causes discomfort because of the time-consuming nature of the repeated sampling. Hence, there has been an effort to find measures that can substitute for or simplify the GnRHST. Even though the basal concentration of LH and the subcutaneous GnRH analogues stimulation test are suggested as alternatives, none of these are sufficient to substitute as a gold standard9-12).
The aim of this study was to investigate the diagnostic accuracy of basal gonadotropin levels for girls with suspected precocious puberty, to determine the methods for the simplification of this test, and to evaluate the factors affecting the positive results of the GnRHST.
Materials and methods
1. Subjects
Among the girls with early pubertal signs who visited our pediatric endocrinology clinic from 2010 to 2012, the subjects who underwent the GnRHST were selected. The inclusion criteria were breast development before the age of 8 years, sexual maturity rate of the breasts of Tanner stage 2 or more, and bone age advancement by 1 or more years. The exclusion criteria were as follows: peripheral precocious puberty, precocious puberty caused by an intracranial lesion, chronic illness, and long-term medication which could affect the HPO axis. Among 339 eligible girls, 336 were included in the study. Two had peripheral precocious puberty caused by a functional ovarian cyst and one had a hypothalamic hamartoma. This study was approved by the Institutional Review Board of Inje University Ilsan Paik Hospital.
2. Methods
We reviewed the medical records of the subjects retrospectively. Clinical data at the time of the GnRHST, such as the chronological age, bone age, height, body weight, body mass index (BMI), sexual maturity rate, parental height, and laboratory profiles, were collected. The standard deviation score (SDS) of the height, body weight and BMI were calculated using the 2007 Korean National Growth Charts13). Bone age was measured using the Greulich-Pyle method14).
The GnRHST was performed in the early morning after an overnight fast. An intravenous cannula was placed in the forearm before the test. Basal serum samples for LH, follicular stimulating hormone (FSH) and estradiol were drawn immediately before the administration of 100 µg of GnRH (Relefact; Sanofi-Aventis, Frankfurt, Germany). After injection, blood samples for LH and FSH were collected at 30, 45, 60 and 90 minutes.
Serum LH, FSH and estradiol were measured using an electrochemiluminescence immunoassay (ECLIA) (Roche Diagnostics GmbH, Manheim, Germany). The range of within-run precision and total precision of the hormonal assays was as follows: 0.7-1.2% and 1.6-2.2% for LH; 2.5-2.8% and 3.6-4.5%, for FSH; 1.7-3.3% and 2.2-4.7% for estradiol, respectively. The limit of detection of LH, FSH and estradiol was 0.1 IU/L, 0.1 IU/L and 5.0 pg/mL, respectively. A peak LH concentration of ≥5 IU/L on the GnRHST was regarded as a positive response15).
3. Statistics
Statistical analyses were performed using Stata 12.1 (StataCorp LP., College Station, TX, USA). Results were described as the mean±standard deviation. Student t-test was used to compare values between the two groups. Pearson correlation was used to evaluate the relationships between basal LH, FSH and peak LH concentration after the GnRHST. Logistic regression analysis was performed to determine the association between a positive response to the GnRHST and other variables. Receiver operating curve (ROC) analyses were carried out to investigate the predictive capacity of the variables16). The Youden index (J), which is defined by "J=maximum (sensitivity+specificity-1)", was used to determine the optimal cutoff value17). A P-value<0.05 was considered statistically significant.
Results
1. Characteristics of the study subjects
Among 336 subjects, 241 (71.7%) showed a positive response and 95 (28.3%) showed a negative response after the GnRHST (Table 1). The mean chronological age was 8.28±0.57 years in the positive group and 8.24±0.57 years in the negative group (P=0.491). The mean bone age was 9.87±0.77 years in the positive group and 9.89±0.70 years in the negative group (P=0.854). The difference between the chronological age and bone age was 1.59±0.67 years in the positive group and 1.65±0.54 years in the negative group (P=0.413). The BMI SDS and target height SDS were significantly higher in the negative group, although the height SDS showed no significant difference between the two groups.
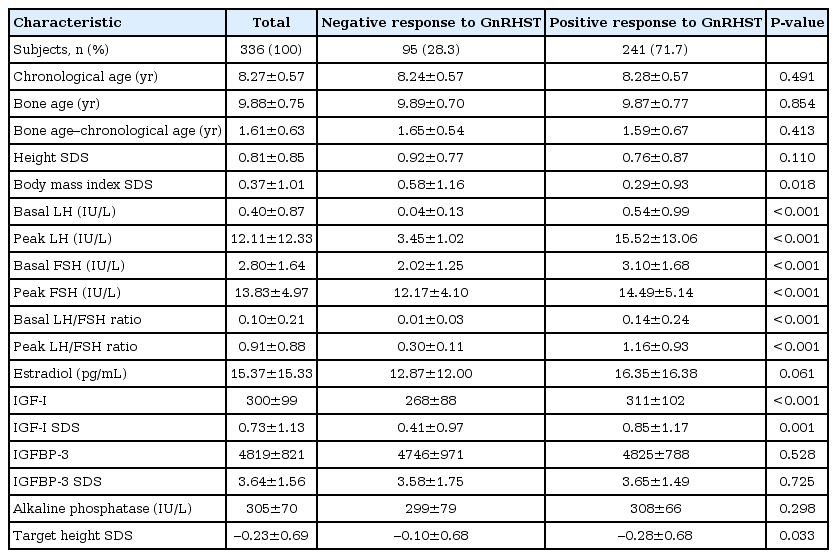
Clinical and biochemical characteristics of the subjects
2. Analysis of GnRH stimulation tests
Basal LH, basal FSH, basal LH/FSH ratio, peak LH, peak FSH and peak LH/FSH ratio were significantly higher in the positive group (Table 1). However insulin-like growth factor-I (IGF-I) and IGF SDS were significantly higher in the positive group. Estradiol, IGF binding protein-3 and alkaline phosphatase (ALP) were not significantly different.
In the positive group, the time to reach peak LH concentration after GnRH administration was 30 minites in 140 patients (58.1%) and 45 minutes in 98 patients (40.7%). A LH level of ≥5 IU/L was achieved in 233 patients (96.7%) at 30 minutes and 240 (99.6%) in 45 minutes. All patients in the pubertal group showed an LH concentration of ≥5 IU/L by 45 minutes after GnRH administration.
3. Logistic regression analysis
Univariate logistic regression analysis was performed to evaluate the factors affecting the results of the GnRH stimulation test. Basal LH, basal FSH, basal LH to FSH ratio, BMI SDS and target height (TH, [maternal height + paternal height]/2-6.5) SDS were significantly correlated. Multiple logistic regression analysis was performed using these variables. To avoid muticollinearity, 2 models were constructed (Table 2). Model 1 included basal LH, basal FSH, BMI SDS and TH SDS; otherwise model 2 included the basal LH to FSH ratio, BMI SDS and TH SDS. A significant predictor of the positive result of the GnRHST was the basal LH in model 1 and the basal LH to FSH ratio in model 2.
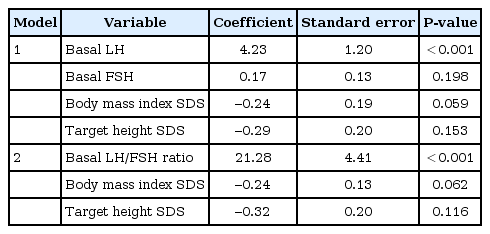
Multiple logistic regression analysis of factors affecting the positive results of the gonadotropin-releasing hormone stimulation test
4. ROC analysis
ROC curves were constructed for the all subjects. The area under the curve (AUC) of LH was 0.740 (95% confidence interval [CI], 0.698 to 0.781) and that of the basal LH to FSH ratio was 0.745 (95% CI, 0.705 to 0.786) (Fig. 1). The AUC of the basal LH to FSH ratio was significantly bigger than that of LH (P=0.027).
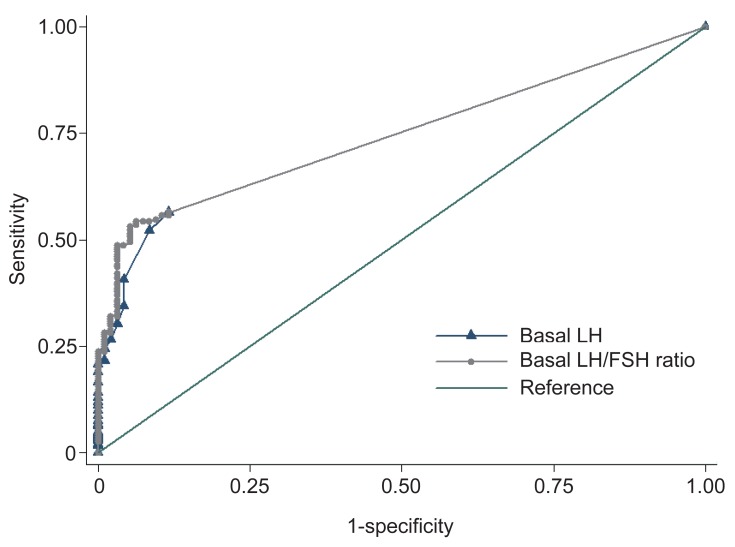
Receiver operator characteristic curves of various thresholds of basal LH levels (area under the curve [AUC], 0.740; 95 % confidence interval [CI], 0.698 to 0.781) and basal LH/FSH ratio (AUC, 0.745; 95% CI, 0.705 to 0.786), for predicting central precocious puberty. LH, luteinizing hormone; FSH, follicular stimulating hormone.
Based on the ROC curve, the optimal cutoff value of the basal LH associated with a positive response was 0.1 IU/L, which demonstrated a sensitivity of 56.4% and a specificity of 88.4%. The best cutoff point of the basal LH to FSH ratio was 0.04, where the sensitivity was 54.4% and the specificity was 93.7%.
5. Analysis of subjects with a basal LH <0.1 IU/L
Among 189 subjects with a basal LH below the detection limit, positive results were reported in 105 patients (55.6%). In this subgroup analysis, basal FSH, peak LH, peak FSH and peak LH/FSH ratio were significantly higher in the positive response group (data not shown). In the logistic regression analysis, the basal FSH was significantly correlated with positive results (P=0.0011). The AUC of the basal FSH was 0.64 (95% CI, 0.56 to 0.72) in the ROC analysis. The best cutoff point of the basal FSH was 1.3 U/L for the positive response, for which the sensitivity was 0.89 and specificity was 0.36. The probability of a positive response after GnRHST increased with the increasing basal FSH in both LH <0.1 IU/L and LH ≥0.1 IU/L group. (Fig. 2)
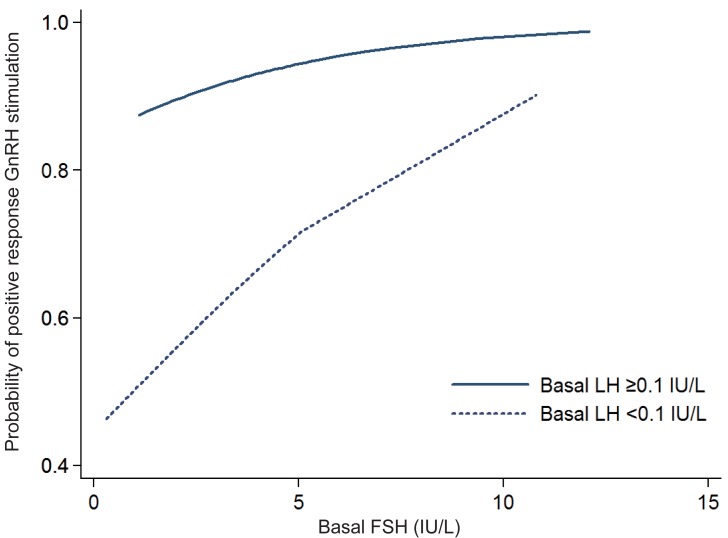
Probability of positive response after gonadotropin-releasing hormone (GnRH) stimulation according to basal luteinizing hormone (LH) and basal follicular stimulating hormone (FSH).
Discussion
The GnRHST is the gold standard for the diagnosis of precocious puberty. However, the GnRHST is time-consuming, expensive and inconvenient for patients and labor-intensive for clinicians. Moreover, the GnRHST showed a negative response in 22.9% to 37.1% of subjects suspected to have precocious puberty18-20). To reduce the rate of negative responses, it is critical to select subjects who have a high possibility of showing positive results on the GnRHST.
In this study, LH and FSH were measured using the ECLIA method which developed recently. ECLIA is a recently developed method with high sensitivity, specificity, rapidity and reproducibility, which has replaced the former radioimmunoassay21). Among 147 female subjects with a basal LH ≥0.1 IU/L, 136 girls (92.5%) showed a positive response on the GnRHST, indicating the sensitivity was 56.4% and specificity was 88.4% In the case of a basal LH/FSH ratio ≥0.04, 131 out of 137 girls (95.6%) showed a positive response, which indicated a sensitivity and specificity of 54.4% and 93.7%, respectively. In this study, the specificity was 100% when the basal LH was ≥0.9 IU/L or basal LH/FSH was 0.19. According to the ROC analysis, the basal LH/FSH ratio was the better method for predicting a positive result after the GnRHST.
A spontaneous LH value of >0.1 IU/L with immunochemiluminometric assay had diagnostic value for the detection of CPP with a sensitivity of 94% of and a specificity of 88% in a study9). A cutoff value of LH>0.3 IU/L increased the specificity to 100%, although the sensi-tivity decreased. Lee et al.19) reported that basal LH with ≥1.1 IU/L with immunoradiometric assay is related pubertal response to GnRHST, which showed 69.1% of sensitivity and 50.5% of specificity. Pasternak et al.22) suggested that a basal LH>0.1 IU/L using chemiluminescent immunometric assay was sufficient for the diagnosis of CPP, which showed 94.7% of sensitivity and 64.4% of specificity. They showed that basal LH/FSH ratio of 0.05 was cutoff value with 71.4% sensitivity and 86.8% specificity, which was inferior to basal LH. In this study, when the basal LH was ≥0.1 IU/L or the basal LH/FSH ratio was ≥0.04, as measured using ECLIA, the diagnosis of CPP was more likely. The cutoff with basal LH ≥0.1 IU/L showed 92.5% of positive predictive value (PPV) and 44.4% of negative predictive value (NPV). In case of basal LH/FSH ≥0.04, PPV and NPV was 95.6% and 44.7%, respectively. Therefore, additional studies are needed for the confirmation of CPP because of the relatively low sensitivity and NPV.
In this study 185 of 241 subjects (43.6%) with a positive response to the GnRHST showed a basal LH that was below the detection limit. Moreover a substantial number of subjects with suspicious to have precocious puberty (189 among 336 subjects, 56.3%) was undetectable basal LH concentration, although basal LH with >0.1 IU/L showed high sensitivity and specificity for the diagnosis of CPP. Therefore it is indispensable to find parameters to discriminate girls with positive response in the group with basal LH<0.1 IU/L. In this study logistic regression analysis showed that the basal FSH was correlated with a positive response to GnRHST. The probability of a positive response after GnRHST showed tendency to increase with basal FSH even in basal LH with below detection limit. However the probability of a positive response was still low when basal FSH was sufficiently high. The sensitivity and specificity of basal FSH were relatively low and the AUC in the ROC analysis was 0.64, which was not high7,9,23). Therefore, the basal FSH alone seemed not be suitable for the initial screening test for diagnosing CPP. Moreover, bone age, bone age advancement and BMI were not associated with a positive response after the GnRHST.
The peak LH concentration in the positive response group was highest at 30 minutes after GnRH administration. In a positive response group, 99.6% of the patients showed a peak LH level of ≥5 IU/L 45 minutes after GnRH stimulation. In all subjects with a positive response, the two samples, 30 and 45 minutes after GnRH injection, demonstrated a 100% peak LH level of ≥5 IU/L. Previous studies have suggested that LH levels between 30 and 60 minutes after GnRH stimulation are sufficient for the diagnosis of CPP18,24-26). Two samples, obtained 30 and 45 minutes after GnRH stimulation, were able to accurately diagnose all CPP patients in this study.
In conclusion, a basal LH ≥0.1 IU/L or a basal LH/FSH ratio ≥0.04 could be a significant predictor of a positive response during the GnRHST. However CPP was demonstrated among the substantial number of subjects, who showed a basal LH below detection limit or basal LH/FSH ratio <0.01, even using highly sensitive ECLIA. Therefore GnRHST is still essential for the diagnostic confirmation of CPP. A simplification of GnRHST, with samples drawn at 30 and 45 minutes, is sufficient for the diagnosis of CPP.
Acknowledgments
This work was supported by grant from Inje University, 2011.
Notes
No potential conflict of interest relevant to this article was reported.