


Introduction
Urinary calcium excretion is used to evaluate various clinical conditions, such as idiopathic hypercalciuria, hyperparathyroidism, hypoparathyroidism, vitamin D intoxication, vitamin D supplementation, and calcium supplementation [1,2]. Calcium excretion depends on age, race, dietary habits, vitamin D status, renal function, and various genetic factors [3-10]. Normal calcium excretion and urinary calcium creatinine ratio (UCaCrR) cutoff values to define hypercalciuria vary in different age groups and by region. Hypercalciuria has been defined as daily urinary excretion of more than 4 mg calcium/kg body weight if a child is over 2 years old [11]. However, this definition assumes that obese children will have higher calcium excretion compared to lean children. The most accepted method of evaluating normal calcium excretion is by collecting urine for 24 hours. Urinary calcium excretion of <200 mg calcium/L is considered normal [1,3]. However, 24-hour urine collection in children and adolescents is cumbersome and inadequate [12,13] compared to estimating by spot UCaCrR, which is easier and more practical. Hypercalciuria is defined as UCaCrR values above the 95th percentile [1,3]. Several studies have shown good correlation between UCaCrR and 24-hour urinary calcium excretion [12-15], but some have also reported poor correlation [16-19]. UCaCrR requires a reference range for different races and geographic regions [1,3]. Reference ranges for various regions and ethnic backgrounds are available in the literature [4-10,17-27], but data from India is sparse [28,29]. In addition, none of these published studies have accounted for the dietary intake of calcium and serum 25-hydroxy-vitamin D (25OHD) levels, which likely affect UCaCrR.
Calcium homeostasis depends on calcium absorption and excretion. Calcium absorption is dependent on calcium intake and vitamin D status. Vitamin D supplementation is known to increase UCaCrR in vitamin D deficient children and adolescents [30,31]. However, UCaCrR is not affected in vitamin D sufficient children and adolescents [32,33]. Hence, vitamin D status is an important determinant of UCaCrR. If calcium absorption is inadequate, serum parathyroid hormone (PTH) rises and calcium homeostasis is maintained by altered bone resorption and renal calcium excretion. Most studies reported in the literature have not taken these factors into account to calculate UCaCrR reference ranges. It is important to select a population with normal calcium intake, vitamin D sufficiency, and normal serum PTH concentration to establish a normal reference range of UCaCrR. Hence, we undertook this study (1) to create reference ranges of UCaCrR by age in healthy vitamin D sufficient children with adequate calcium intake, and (2) to define cutoff limits of UCaCrR for defining hypercalciuria.
Materials and methods
1. Subjects
This study was performed in 4 schools in Delhi (Latitude North 28.38º, East 77.12º), India (representing mid socioeconomic strata) with consent from school authorities, parents/guardians, and verbal assent from children. Parents were asked to sign the consent form after they were provided with details of the study in a patient information sheet and allowed to ask the first author any questions. All children and adolescents with vitamin D deficiency were supplemented with vitamin D for 6 months as part of a trial (Fig. 1) [31]. There were 702 children and adolescents who achieved serum 25OHD value of ≥50 nmol/L with serum PTH of <65 ng/L. Of these, 229 had dietary calcium intake less than the recommended daily allowance (RDA) as per the Indian Council of Medical Research (ICMR)34); these subjects were excluded from the study. The remaining 473 subjects with adequate daily dietary intake of calcium were included in the analysis (Fig. 1). Subjects were advised not to change their lifestyle with regard to sun exposure and dietary habits during the study period. Children and adolescents who were either on drugs affecting urinary calcium excretion, such as calcium, vitamin D, glucocorticoids, anti-tubercular drugs, or antiepileptic drugs, or suffering from any systemic illness were excluded from the study.
Dietary calcium assessment was carried out using a 24-hour recall method with one working day and one holiday wherein all foods consumed in the last 24 hours were evaluated with household measures and ingredients. Total daily calcium intake was estimated for both days using a computer based comprehensive diet assessment known as the DietSoft software, version:1.1.7 (developed by Invincible IDeAS [www.invincibleideas.com] based on the book Nutritive Value of Indian Foods by C Gopalan, BV RamaSastri, and SC Balasubrsmanian, National Institute of Nutrition, ICMR, Hyderabad, India. The ICMR recommends 600 mg of calcium for ages 1–10 years and 800 mg for ages 11–18 years for both genders [34]. The mean dietary calcium intake in boys and girls was adequate as per the RDA recommended by ICMR (2010) (boys: 1151±451 mg/daily; girls 1080±390 mg/daily), but was significantly higher in boys than girls (median [range]: boys, 1,001 mg (600–3,559 mg) and girls, 953 mg [616–3477 mg]; P=0.031 [Mann-Whitney test]).
2. Data collection
Anthropometric measurements such as height, weight, and body mass index (BMI) were noted at baseline. Height was measured to the nearest 0.1 cm using a portable wall mounted stadiometer (Holten's Stadiometer, 200 cm/78 inches, Model WS045, Narang Medical Ltd., Delhi, India) with subjects standing straight with their head held in the Frankfurt plane. Weight was measured to the nearest 0.1 kg without shoes on and with light clothes on using an electronic scale (EQUINOX Digital weighing machine, Model EB6171, Equinox Overseas Private Ltd., New Delhi, India). BMI defined as the ratio of body weight to height squared and expressed in kg/m2. Weight categories were defined by revised criteria of the Indian Association of Pediatrics. Participants above the adult equivalent BMI of 23 kg/m2 were defined as overweight, and those above the adult equivalent BMI of 27 kg/m2 were defined as obese [35].
Blood samples were collected in the fasting state between 8:00 AM to 9:00 AM and centrifuged. The serum was separated into three aliquots at the study site and transported in dry ice to the laboratory. Serum calcium, phosphorus, and alkaline phosphatase (ALP) were estimated on the same day. The 2 remaining aliquots were frozen at -20ºC for estimation of serum 25OHD and PTH at a later date. Serum calcium, serum phosphate, and serum ALP were measured with a commercially available kit using an automated biochemistry analyzer Cobas-c 501 (Roche Diagnostics, Manhiem, Germany). The normal ranges were: for serum total calcium, 2.2–2.7 mmol/L for 2–12 year old children and 2.1–2.6 mmol/L for 12-18 year old children; inorganic phosphorus, 1.0–1.7 mmol/L for 7–12 year old children and 0.9–1.5 mmol/L for 13–16 year old children; ALP, 129–417 U/L for 10–<13 year old children, 57–254 U/L for 13–<15 year old children, 50–117 U/L for 15–<18 year old girls, 129–417 U/L for 10–<13 year old boys, 116–468 U/L for 13–<15 year old boys, and 82–331 U/L for 15–<18 year old boys. Serum 25OHD was assayed using a chemiluminescence method (Diasorin, Stillwater, MN, USA), and PTH (reference range, 10–65 ng/L) was assayed using an electrochemiluminiscence assay (Roche Diagnostics, GMDMManheim, Germany). Intra- and interassay coefficients of variation were 3.5% and 5%, respectively, for serum 25OHD and 2.4% and 3.6%, respectively, for serum PTH. Urinary samples were collected to assess random UCaCrR (both calcium and creatinine measured in mg) using the Cobas-C 501 system (Roche Diagnostics).
3. Statistical analysis
Analysis was performed using IBM SPSS Statistics ver. 20.0 (IBM Co., Armonk, NY, USA). Descriptive statistics were calculated as the mean±standard deviation (95% confidence intervals). Significance of the parameters between genders was calculated via the Student t-test, and analysis of variance was used to study the difference in means of various parameters among weight groups. Dietary calcium, serum PTH, urinary calcium, urinary creatinine, and UCaCrR were not normally distributed so were also expressed as medians and ranges. These parameters were analyzed with Mann-Whitney and Kruskal-Wallis tests. Pearson correlation was used to evaluate the relationship between various parameters and UCaCrR. A P-value of <0.05 was considered statistically significant.
Results
The baseline anthropometric, biochemical, and hormonal parameters of participants are presented in Table 1. The mean age and BMI of 473 study subjects (62.2% boys, 37.8% girls) were 11.2±2.6 years and 18.0±3.6 kg/m2, respectively. Most parameters in boys and girls presented in Table 1 were comparable except for dietary calcium intake, serum phosphate, ALP, and PTH. Forty subjects (8.5%) were obese, 81 (17.1%) were overweight, and the remaining 352 subjects were normal weight. The overall mean serum 25OHD and PTH were 33.6±11.2 ng/mL and 33.5±12.1 pg/mL, respectively.
There was no gender difference observed in the mean and median values of random UCaCrR (Table 1). The mean values, percentiles (5th, 50th, 95th, and 97.5th), and 95% confidence intervals of UCaCrR by age are given in Table 2. The UCaCrR was significantly higher in prepubertal subjects (age≤10 years) (mean=0.059±0.037, median=0.055, 95th percentile=0.136) compared to those >10 years old (mean=0.050±0.036, median=0.041, 95th percentile=0.123) (P=0.02). The maximum mean and median values of UCaCrR were observed at 8 years. The minimum median value of UCaCrR was at 14 years of age, and the minimum mean value was at 11 years of age. The 95th percentile of UCaCrR in the study population was 0.126 (Table 2). There was no difference in UCaCrR between different weight categories (P=0.353) (Table 3).
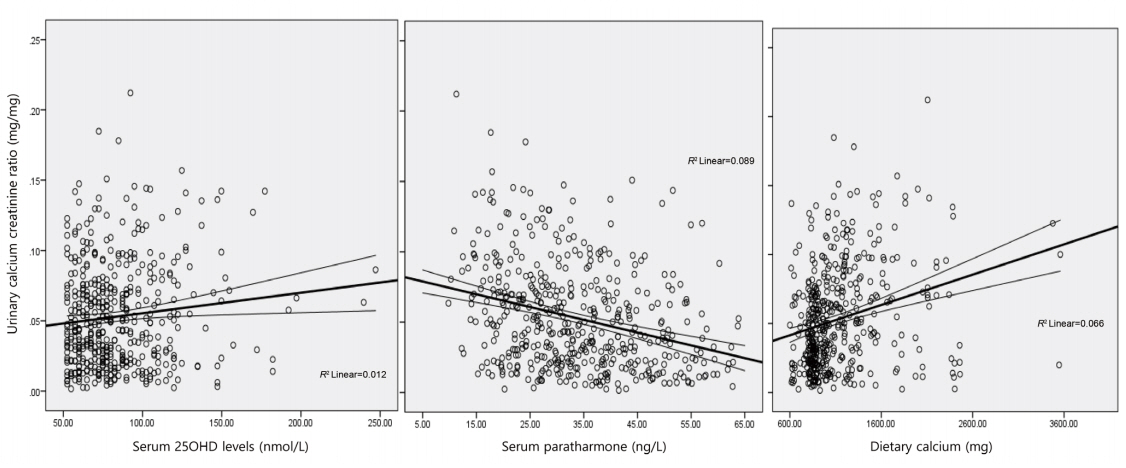
UCaCrR was positively correlated with dietary calcium intake (r=0.256, P<0.001) (Fig. 2) and serum 25OHD (r=0.111, P=0.016) (Fig. 2), and it was inversely correlated with serum PTH (r=-0.299, P<0.001) (Fig. 2) and serum ALP (r=-0.098, P=0.037). There was no significant correlation between UCaCrR and age (r=-0.040, P=0.382), BMI (r=0.019, P=0.331), or serum calcium (r=0.078, P=0.089).
Discussion
UCaCrR is used to monitor calcium and vitamin D supplementation and various other diseases [1,2]. Although 24-hour urinary calcium excretion is considered the gold standard [11], there are practical difficulties in collecting 24-hour urinary samples, particularly in the pediatric population [12]. Collection of spot or random urine samples, an easy and practical method to assess calcium excretion, has been recommended for epidemiologic studies [12-14]. Since there is wide variation in UCaCrR values among various geographic regions, reference ranges and 95th percentile values specific for each population are needed [4-10,14-27]. In the present study, we report normative data of UCaCrR in healthy North Indian children and adolescents.
The overall mean UCaCrR of 0.0530±0.0368 was significantly lower than values reported from different geographic regions such as Turkey, Lebanon, Iran, Italy, and Argentina [5,8,10,13,23,24,27,36], including a report from India where the reported mean was 0.10±0.094 [29]. The 95th percentile of UCaCrR in the present study was 0.14 and ranged from 0.10–0.20 among different age groups. Cutoff values of <0.20 [1] and <0.21 [3] have been considered normal in studies including children older than 2 years. Two earlier studies from India reported varied cutoff values of 0.15 [30] and 0.29 [29]. Cutoff values used to define hypercalciuria in children vary widely by country and range from the lowest value of 0.15 in India [28] to the highest value of 0.36 in Iran [36]. Cutoff values from most other countries ranged from 0.20–0.29 [4-10,12,13,20]. The present study reports lower UCaCrR cut off levels than most other published studies, except one from Korea.
The lower UCaCrR value in the present study emphasizes that daily dietary calcium intake and vitamin D status are important determinants of UCaCrR. Variations in UCaCrR values in different populations are probably due to differences in daily dietary calcium intake [37] and serum levels of 25OHD [38]. Mean serum 25OHD levels reach normal values of >20 ng/mL and PTH returns to within normal range following 3 months of daily vitamin D supplementation with, as shown in our previous study in school girls [30]. It is therefore safe to assume that children in the present study would have had normal bone turnover for at least 3 months with normal daily calcium intake. Hence, the UCaCrR in the present study with adequate intake of dietary calcium, normal serum 25OHD, and serum PTH within normal range for a sufficiently long duration of time (at least 3 months) reflects the true normative range of UCaCrR in Indian children.
Calcium excretion has also been correlated with salt intake and natriuresis [12]. A study from West Bengal, India, where the population consumes a high quantity of sea food with high salt content, reported high mean values of UCaCrR among children [39].
There are conflicting reports on the correlation of UCaCrR with age. Some studies have observed a strong correlation [7,9,36], whereas others have shown either weak [5,27] or no correlation [24,29]. This likely results from the inclusion of different age ranges in different studies. Gül et al. [20] studied subjects with a similar age range in Turkey and also reported different values of UCaCrR among different age groups. We observed a sharp decline in UCaCrR at the age of 11 years, which was also noted in 11-year-old children from Turkey [20] and 10-year-old Lebanese children [10]. This decline may be due to decreased dietary calcium intake with aging. The maximum UCaCrR noted at the age of 8 years in this study was consistent with similarly aged Iranian children [18].
A significantly higher mean UCaCrR in prepubertal children than peri-pubertal and pubertal children was also reported among children from Turkey [20] and Iran [23]. These differences are explained by the following observations: (1) significantly higher serum 25OHD levels in prepubertal children compared to periand postpubertal children (88.5±33.5 nmol/L vs. 81.6±24.5 nmol/L, P=0.011) has also been reported [8,9]; (2) a positive correlation between UCaCrR and calcium intake has been reported with higher daily intake of calcium per kg body weight in children ≤10 years compared to those >10 years (40.4±18.6 vs. 28.4±13.3, P<0.001) [40].; (3) lower urinary creatinine values in children ≤10 years compared to those >10 years (100±71 mg vs. 126±70 mg, P<0.001) may also reflect lower UCaCrR; and (4) although sodium intake also affects calcium excretion [39], it was not assessed in this study.
The absence of a difference in UCaCrR among genders in the present study was also observed in several other studies, including one from India [5,10,13,29,39]. However, Nuzzo et al. [24] from Italy and Wong et al. [26] from China reported significantly higher UCaCrR values in girls. The lack of correlation between UCaCrR and weight categories seen in the present study was also reported by Gül et al. [20] and Nuzzo et al. [24]
Natriuresis is associated with calciuresis [12]. Hence, sodium intake is likely to affect UCaCrR. In this study, we did not assess dietary intake of salt or measured urinary sodium, which is a limitation of our study.
In conclusion, the cutoff value of UCaCrR used to define hypercalciuria in vitamin D sufficient North Indian children with adequate daily intake of calcium and without secondary hyperparathyroidism is 0.13 for children and adolescents >10 years and 0.14 for children between 5–10 years. No significant difference in UCaCrR was noted between genders and among different weight categories. Reported differences in UCaCrR values in different populations and age groups are likely due to differences in daily dietary calcium intake and serum 25OHD levels.