Ann Pediatr Endocrinol Metab Search

CLOSE


Ann Pediatr Endocrinol Metab > Volume 21(3); 2016 > Article
Kim, Park, Kim, Im, and Han: The cutoff values of indirect indices for measuring insulin resistance for metabolic syndrome in Korean children and adolescents

Abstract

Purpose

The prevalence rates of metabolic syndrome (MetS) and percentile distribution of insulin resistance (IR) among Korean children and adolescents were investigated. The cutoff values of IR were calculated to identify high-risk MetS groups.

Methods

Data from 3,313 Korean subjects (1,756 boys and 1,557 girls, aged 10–18 years) were included from the Korean National Health and Nutrition Examination Survey conducted during 2007–2010. Three different sets of criteria for MetS were used. Indirect measures of IR were homeostasis model assessment (HOMA-IR) and triglyceride and glucose (TyG) index. The cutoff values of the HOMA-IR and TyG index were obtained from the receiver operation characteristic curves.

Results

According to the MetS criteria of de Ferranti el al., Cook et al., and the International Diabetes Federation, the prevalence rates in males and females were 13.9% and 12.3%, 4.6% and 3.6%, and 1.4% and 1.8%, respectively. Uses these 3 criteria, the cutoff values of the HOMA-IR and TyG index were 2.94 and 8.41, 3.29 and 8.38, and 3.54 and 8.66, respectively. The cutoff values using each of the 3 criteria approximately corresponds to the 50th–75th, 75th, and 75th–90th percentiles of normal HOMA-IR and TyG index levels.

Conclusion

This study describes the prevalence rates of MetS in Korean children and adolescents, an index of IR, and the cutoff values for MetS with the aim of detecting high-risk groups. The usefulness of these criteria needs to be verified by further evaluation.

Introduction

Metabolic syndrome (MetS) is known as a major risk factor in cardiovascular disease, diabetes, and cerebral vascular disease1,2,3,4,5,6,7,8,9), and it has become a very important public problem due to the worldwide increased prevalence of obesity in adults10). According to South Korean reports, the local prevalence rate of obesity in children and adolescents is increasing rapidly11), and is closely related to MetS-related disorders, such as cardiovascular disease, diabetes, and hyperlipidemia12). As MetS at young age is so closely connected to that in adulthood, early selection of at-risk groups and early management are very important13). The widely reported variation in the prevalence rate of MetS in childhood is due to the absence of a unifying definition of this condition in childhood14).
Considering that insulin resistance (IR) is a cause of MetS, it is possible to screen at-risk groups for childhood MetS15). Although direct measurements of IR are possible with the pancreatic suppression test and hyperinsulinemic euglycemic glucose clamp technique, these direct tests are invasive, complex, and expensive16). Therefore, clinical use of these methods is limited during childhood. Instead, indirect index, such as the homeostasis model assessment of IR (HOMA-IR), is widely used clinically17). Based on the findings that elevation of serum triglyceride (TG) is related to a decrease in insulin sensitivity18) by interfering with muscle glucose metabolism19), another indirect index, the TG and glucose index (TyG index), has been used in some adult studies20,21,22). The TyG index is based on fasting TG and glucose instead of fasting insulin and glucose. Given the high cost incurred in insulin measurement and the absence of a standard measurement method, the clinical application of the TyG index is convenient. However, there are few pediatric studies and reference criteria in Korea.
The aim of the present study was to calculate the prevalence of MetS, tabulate the distribution of the percentile values of the HOMA-IR and TyG index, and propose a cutoff value to classify an at-risk MetS group among Korean children and adolescents.

Materials and methods

1. Subjects

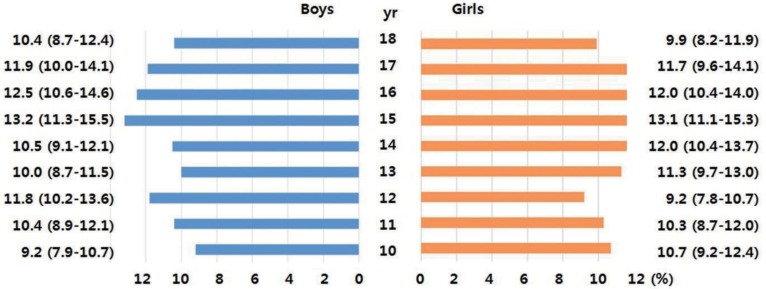
Primary data were obtained from the fourth and part of the fifth Korean National Health and Nutrition Examination Survey (KNHANES, 2007–2010). These surveys are conducted periodically by the Division of Health and Nutrition Survey, Korea Center for Disease Control and Prevention of the Ministry of the Health and Welfare. The KNHANES consists of health- and nutrition-related questions and health examinations of a sample of people selected from across the country every year. Among the 4,244 children and adolescents aged 10–18 years who participated in the survey, 3,313 (1,756 boys and 1,557 girls) individuals were included in the final analysis after excluding 931 individuals with missing data on body measurements or inadequate blood test results (i.e., without fasting for 8 hours). The age distribution of the participants by weighted sampling is shown in Fig. 1.

2. Health screening and measurement of biochemical indies

A team who took part in regular education training and evaluation each year collected all the data. The waist circumference (WC) was measured at the mid-point between the lower end of the rib and upper end of the ilium. After the subjects had rested for 5 minutes in a sitting position, their blood pressure (BP) was measured by the duty nurses using Baumanometer desk model 0320 (Baum Co., Copiague, NY, USA). Three measurements of the systolic and diastolic BP were recorded, and the average value was used in the analyses.
Venous blood samples were collected after fasting 8 hours, and were analyzed at the central laboratory (Seoul Medical Science Institute, Seoul, Korea in 2007; MEODIN Medical Institute, Seoul, Korea in 2008–2010). Fasting glucose, TG, and high-density lipoprotein cholesterol were analyzed by an enzyme assay (Hitachi Automatic Analyzer 7600, Hidachi, Tokyo, Japan), and fasting insulin was analyzed using a gamma counter (1470Wizard, Perkin-Elmer, Turtu, Finland) with an immunoradiometric assay (INS-IRMA, Biosourse, Belgium). Health screening and measurement of biochemical indices were described according to the guidebook of the fourth and fifth KNHANES23,24).

3. Definitions

This study used 3 of the most commonly used criteria for MetS in children and adolescents (Table 1): those of Cook et al.25) and de Ferranti et al.26), – modified from the National Cholesterol Education Program Adults Treatment Panel III, and those of the International Diabetes Federation (IDF)27), The HOMA-IR and TyG index were used as indirect indies of IR. HOMA-IR was calculated as follows: HOMA-IR=fasting insulin (µU/mL)×fasting glucose (mmol/L)/22.5. The TyG index was calculated as follows: TyG index=Ln [triglyceride (mg/dL)×fasting glucose (mg/dL)/2]17,20).

4. Statistics

Statistical analysis was performed using IBM SPSS Statistics ver. 21.0 (IBM Co., Armonk, NY, USA). Variables are presented as means with their 95% confidence intervals (CIs). The following percentile values of the HOMA-IR and TyG index were calculated: 10th, 25th, 50th, 75th, and 90th. Receiver operation characteristic (ROC) analysis and the area under the curve (AUC) were used to identify the sensitivity and specificity for HOMA-IR and TyG index, respectively. The optimal cutoff values were defined as the point at which the value of "sensitivity + specificity -1" was maximum (Youden index). This cutoff value corresponds to the point on the ROC curve which has the maximum vertical distance from the curve to the chance line.

Results

The general characteristics of the participants are shown in Table 2. The highest prevalence rates of MetS in males and females were 13.9% and 12.3%, respectively, according to the criteria of de Ferranti et al., and the lowest prevalence rates were 1.4% and 1.8%, respectively, according to the IDF criteria. The prevalence rates of MetS for males and females using the criteria of Cook et al. were 4.6% and 3.6%, respectively, so fell somewhere in the middle of the rates estimated by the other criteria. The clinical characteristics of the participants with MetS are shown in Table 3.
The mean values of HOMA-IR were 2.97 (95% CI, 2.90–3.04) in males and females, 2.92 (95% CI, 2.83–3.00) in males, and 3.03 (95% CI, 2.93–3.13) in females. The mean values of the TyG index were 8.13 (95% CI, 8.11–8.16) in total males and females, 8.11 (95% CI, 8.08–8.14) in males, and 8.15 (95% CI, 8.13–8.19) in females. The percentile distributions of the HOMA-IR and TyG index are shown in Table 4.
The ROC curves of the HOMA-IR and TyG index for MetS according to the three criteria are displayed in Fig. 2. AUC of the HOMA-IR and TyG index was 0.783 and 0.915, respectively, using the criteria of Cook et al.; 0.742 and 0.878, respectively, using the criteria of de Ferranti et al.; and 0.827 and 0.940, respectively, using the criteria of the IDF. The cutoff values of the HOMA-IR and TyG index according to the ROC curves are tabulated in Table 5. The cutoff values of the HOMA-IR and TyG index were 3.29 and 8.48, respectively, according to the criteria of Cook et al.; 2.96 and 8.41, respectively, according to the criteria of de Ferranti et al.; and 3.54 and 8.66, respectively, according to the criteria of the IDF. The sensitivities and specificities of the cutoff values for the HOMA-IR and TyG index are tabulated in Table 5.

Discussion

During childhood and adolescence, the physical and physiological changes according to the age and sex are so enormous, that a unified standard for MetS cannot be estimated. As a result, the exact prevalence of MetS in Korean children and adolescents is not known. We used three well-known criteria and data from the fourth and fifth KNHANES to calculate the prevalence of MetS. The prevalence of MetS in children and adolescents varied, from 1.4% to 13.9%. The prevalence rates in males and females were lowest (1.4% and 1.8%, respectively) using the criteria of the IDF and highest using the criteria of de Ferranti et al. (13.9% and 12.3%, respectively). The inclusion of central obesity and a higher TG level were responsible for the low prevalence rates using the IDF criteria. The high rate using the criteria of de Ferranti et al. was due to the use of a lower TG level. The prevalence of MetS in Europe and the United States was 2.6% and 2.2%, respectively, using the IDF criteria28), higher than the prevalence found in the present study. The discord in the results may be due to the higher obesity rate in Europe and the United States.
In this study, we tried to confirm the percentile distribution of indirect indices of MetS, such as HOMA-IR and TyG in Korean children and adolescents, and to analyze the ability of these indirect indices to diagnose MetS with the aim of, suggesting cutoff values to screen at-risk groups of MetS.
In the ROC curve analysis of the correlation between the indirect indices and MetS, the AUC of the TyG index was larger than that of the HOMA-IR using all three criteria (Fig. 2). The TyG index uses 2 measures of fasting glucose and TG, whereas HOMA-IR uses only one measure of fasting glucose in MetS (Table 1). Based on the results of this study, the TyG index seemed to be a more useful screen than HOMA-IR to determine the risk of MetS. Both the TyG index and HOMA-IR were reported to reflect the IR in healthy adult29), and TyG index was better associated with carotid atherosclerosis than HOMA-IR in a report30). In hyperglycemic clamp validated study, correlation for the TyG index was better compared with HOMA-IR in adult population22). However, from a practical point of view, the TyG index is not useful to ascertain IR in children because it has not been widely applied in the pediatric field. Thus, it is difficult to compare the superiority of the index with that of HOMA-IR. We suggest that the TyG index could be used as an ancillary measure to support the HOMA-IR method.
For screening, the cutoff point used in this study was the highest value of the Youden index in the area of highest sensitivity rather than specificity. The cutoff values of the HOMA-IR and TyG index using the criteria of Cook et al. were 3.29 and 8.48, respectively, which are close to the 75th percentile in healthy children and adolescent distribution. The cutoff values using the criteria of de Ferranti et al. were located between the 50th and 75th percentiles, and the values determined by the IDF criteria were between the 75th and 90th percentiles. We attributed these discrepancies to the different MetS definitions of the three criteria. The criteria of the IDF are stricter than those of Cook et al., whereas those of de Ferranti et al. are less strict than Cook et al.'s criteria (Table 1). The stratification of an at-risk group using the three criteria may be helpful, however, the clinical usefulness of the criteria needs to be verified in further studies.
The present study has some limitations. One of the limitations was not discriminating children and adolescents. During the pubertal period, IR increases at the onset of puberty, but it returns to prepubertal levels by the end of puberty31). In cases of obesity, the increases in the level of IR during puberty are more pronounced, and these do not return to prepubertal levels at the end of puberty32). Although the subgroups in the present study were analyzed according to the age or puberty, the ROC curves were not meaningful because of the low incidence of MetS. Additional studies of the influence of puberty on IR are needed. The other limitation was that the HOMA-IR and TyG index represent indirect rather direct indices of IR.
In conclusion, we suggested three different cutoff points to screen at-risk groups of Korean children and adolescent for MetS using HOMA-IR and TyG index.

Notes

Conflict of interest: No potential conflict of interest relevant to this article was reported.

References

1. Pollare T, Lithell H, Berne C. Insulin resistance is a characteristic feature of primary hypertension independent of obesity. Metabolism 1990;39:167–174. PMID: 2405235.
crossref pmid
2. Wilson PW, D'Agostino RB, Parise H, Sullivan L, Meigs JB. Metabolic syndrome as a precursor of cardiovascular disease and type 2 diabetes mellitus. Circulation 2005;112:3066–3072. PMID: 16275870.
crossref pmid
3. Perry IJ, Wannamethee SG, Whincup PH, Shaper AG, Walker MK, Alberti KG. Serum insulin and incident coronary heart disease in middle-aged British men. Am J Epidemiol 1996;144:224–234. PMID: 8686691.
crossref pmid pdf
4. Després JP, Lamarche B, Mauriège P, Cantin B, Dagenais GR, Moorjani S, et al. Hyperinsulinemia as an independent risk factor for ischemic heart disease. N Engl J Med 1996;334:952–957. PMID: 8596596.
crossref pmid
5. Meigs JB, Wilson PW, Fox CS, Vasan RS, Nathan DM, Sullivan LM, et al. Body mass index, metabolic syndrome, and risk of type 2 diabetes or cardiovascular disease. J Clin Endocrinol Metab 2006;91:2906–2912. PMID: 16735483.
crossref pmid pdf
6. Lakka HM, Lakka TA, Tuomilehto J, Sivenius J, Salonen JT. Hyperinsulinemia and the risk of cardiovascular death and acute coronary and cerebrovascular events in men: the Kuopio Ischaemic Heart Disease Risk Factor Study. Arch Intern Med 2000;160:1160–1168. PMID: 10789610.
crossref pmid
7. Feskens EJ, Kromhout D. Hyperinsulinemia, risk factors, and coronary heart disease. The Zutphen Elderly Study. Arterioscler Thromb 1994;14:1641–1647. PMID: 7918315.
crossref pmid
8. Goodarzi MO, Erickson S, Port SC, Jennrich RI, Korenman SG. Relative impact of insulin resistance and obesity on cardiovascular risk factors in polycystic ovary syndrome. Metabolism 2003;52:713–719. PMID: 12800096.
crossref pmid
9. Kuusisto J, Mykkänen L, Pyörälä K, Laakso M. Hyperinsulinemic microalbuminuria. A new risk indicator for coronary heart disease. Circulation 1995;91:831–837. PMID: 7828312.
crossref pmid
10. Ford ES, Giles WH, Dietz WH. Prevalence of the metabolic syndrome among US adults: findings from the third National Health and Nutrition Examination Survey. JAMA 2002;287:356–359. PMID: 11790215.
crossref pmid
11. Chu MA, Choe BH. Obesity and metabolic syndrome among children and adolescents in Korea. J Korean Med Assoc 2010;53:142–152.
crossref
12. Lim H, Xue H, Wang Y. Association between obesity and metabolic co-morbidities among children and adolescents in South Korea based on national data. BMC Public Health 2014;14:279. PMID: 24666605.
crossref pmid pmc pdf
13. Morrison JA, Friedman LA, Wang P, Glueck CJ. Metabolic syndrome in childhood predicts adult metabolic syndrome and type 2 diabetes mellitus 25 to 30 years later. J Pediatr 2008;152:201–206. PMID: 18206689.
crossref pmid
14. Zimmet P, Alberti G, Kaufman F, Tajima N, Silink M, Arslanian S, et al. The metabolic syndrome in children and adolescents. Lancet 2007;369:2059–2061. PMID: 17586288.
crossref pmid
15. Martin BC, Warram JH, Krolewski AS, Bergman RN, Soeldner JS, Kahn CR. Role of glucose and insulin resistance in development of type 2 diabetes mellitus: results of a 25-year follow-up study. Lancet 1992;340:925–929. PMID: 1357346.
crossref pmid
16. Bergman RN, Phillips LS, Cobelli C. Physiologic evaluation of factors controlling glucose tolerance in man: measurement of insulin sensitivity and beta-cell glucose sensitivity from the response to intravenous glucose. J Clin Invest 1981;68:1456–1467. PMID: 7033284.
crossref pmid pmc
17. Matthews DR, Hosker JP, Rudenski AS, Naylor BA, Treacher DF, Turner RC. Homeostasis model assessment: insulin resistance and beta-cell function from fasting plasma glucose and insulin concentrations in man. Diabetologia 1985;28:412–419. PMID: 3899825.
crossref pmid
18. Pan DA, Lillioja S, Kriketos AD, Milner MR, Baur LA, Bogardus C, et al. Skeletal muscle triglyceride levels are inversely related to insulin action. Diabetes 1997;46:983–988. PMID: 9166669.
crossref pmid
19. Kelley DE, Goodpaster BH. Skeletal muscle triglyceride: an aspect of regional adiposity and insulin resistance. Diabetes Care 2001;24:933–941. PMID: 11347757.
crossref pmid
20. Du T, Yuan G, Zhang M, Zhou X, Sun X, Yu X. Clinical usefulness of lipid ratios, visceral adiposity indicators, and the triglycerides and glucose index as risk markers of insulin resistance. Cardiovasc Diabetol 2014;13:146. PMID: 25326814.
crossref pmid pmc
21. Unger G, Benozzi SF, Perruzza F, Pennacchiotti GL. Triglycerides and glucose index: a useful indicator of insulin resistance. Endocrinol Nutr 2014;61:533–540. PMID: 25174769.
crossref pmid
22. Vasques AC, Novaes FS, de Oliveira Mda S, Souza JR, Yamanaka A, Pareja JC, et al. TyG index performs better than HOMA in a Brazilian population: a hyperglycemic clamp validated study. Diabetes Res Clin Pract 2011;93:e98–e100. PMID: 21665314.
crossref pmid
23. Ministry of Health & Welfare, Korea Centers for Disease Control and Prevention. Korea National Health and Nutrition Examination Survey (KNHANES IV). Cheongju: Ministry of Health & Welfare. Korea Centers for Disease Control and Prevention. 2009.

24. Ministry of Health & Welfare. Korea Centers for Disease Control and Prevention. Korea National Health and Nutrition Examination Survey (KNHANES V). Cheongju: Ministry of Health & Welfare. Korea Centers for Disease Control and Prevention. 2010.

25. Cook S, Weitzman M, Auinger P, Nguyen M, Dietz WH. Prevalence of a metabolic syndrome phenotype in adolescents: findings from the third National Health and Nutrition Examination Survey, 1988-1994. Arch Pediatr Adolesc Med 2003;157:821–827. PMID: 12912790.
crossref pmid
26. de Ferranti SD, Gauvreau K, Ludwig DS, Neufeld EJ, Newburger JW, Rifai N. Prevalence of the metabolic syndrome in American adolescents: findings from the Third National Health and Nutrition Examination Survey. Circulation 2004;110:2494–2497. PMID: 15477412.
crossref pmid
27. Zimmet P, Alberti G, Kaufman F, Tajima N, Silink M, Arslanian S, et al. The metabolic syndrome in children and adolescents. Lancet 2007;369:2059–2061. PMID: 17586288.
crossref pmid
28. Friend A, Craig L, Turner S. The prevalence of metabolic syndrome in children: a systematic review of the literature. Metab Syndr Relat Disord 2013;11:71–80. PMID: 23249214.
crossref pmid
29. Simental-Mendía LE, Rodríguez-Morán M, Guerrero-Romero F. The product of fasting glucose and triglycerides as surrogate for identifying insulin resistance in apparently healthy subjects. Metab Syndr Relat Disord 2008;6:299–304. PMID: 19067533.
crossref pmid
30. Irace C, Carallo C, Scavelli FB, De Franceschi MS, Esposito T, Tripolino C, et al. Markers of insulin resistance and carotid atherosclerosis. A comparison of the homeostasis model assessment and triglyceride glucose index. Int J Clin Pract 2013;67:665–672. PMID: 23758445.
crossref pmid
31. Moran A, Jacobs DR Jr, Steinberger J, Hong CP, Prineas R, Luepker R, et al. Insulin resistance during puberty: results from clamp studies in 357 children. Diabetes 1999;48:2039–2044. PMID: 10512371.
crossref pmid
32. Pilia S, Casini MR, Foschini ML, Minerba L, Musiu MC, Marras V, et al. The effect of puberty on insulin resistance in obese children. J Endocrinol Invest 2009;32:401–405. PMID: 19794287.
crossref pmid
Fig. 1

Age distribution of the participants by weighted sampling.

apem-21-143-g001.jpg
Fig. 2

Receiver operation characteristic curves for metabolic syndrome. (A) Using the criteria of Cook et al.25), (B) using the criteria of de Ferranti et al.26), and (C) using the criteria of International Diabetes Federation27). TyG, triglyceride glucose; HOMA-IR, homeostasis model assessment of insulin resistance; AUC, area under the curve.

apem-21-143-g002.jpg
Table 1

Criteria and definitions for metabolic syndrome in children and adolescents

Criteria/components Cook et al. (2003)25) de Ferranti et al. (2004)26) IDF (2007)27)(10–16 yr)*
Central obesity (WC) ≥90th percentile ≥75th percentile ≥90th percentile
Glucose ≥110 mg/dL ≥110 mg/dL ≥100 mg/dL
BP ≥90th percentile ≥90th percentile Systolic ≥ 130 mmHg
Diastolic ≥ 85 mmHg
Triglycerides ≥110 mg/dL ≥100 mg/dL ≥150 mg/dL
HDL-cholesterol ≤40 mg/dL <50 mg/dL (girls) <40 mg/dL
<45 mg/dL (boys)
Definition for MetS Three or more among the 5 criteria Three or more among the 5 criteria Central obesity and the presence of 2 or more other criteria

IDF, International Diabetes Federation; WC, waist circumference; BP, blood pressure; HDL, high density lipoprotein; MetS, metabolic syndrome.

*For adolescents older than 16 years, the IDF criteria for adults were used.

Table 2

General characteristics of the participants by sex

Characteristic Male (n=1,756) Female (n=1,557)
Age (yr) 14.1 (14.0-14.3) 14.1 (13.9–14.2)
Waist circumference (cm) 71.8 (71.2–72.4) 67.2 (66.6–67.7)
Body mass index (kg/m2) 21.0 (20.8–21.2) 20.1 (19.9–20.4)
Systolic BP (mmHg) 106.4 (105.7–107.1) 101.9 (101.3–102.5)
Diastolic BP (mmHg) 65.9 (65.3–66.5) 64.6 (64.0–65.2)
Fasting glucose (mg/dL) 89.3 (88.9–90.0) 88.4 (88.0–88.8)
HDL-cholesterol (mg/dL) 48.3 (47.8–48.8) 50.7 (50.1–51.3)
Triglyceride (mg/dL) 86.8 (83.3–90.3) 89.5 (86.3–92.7)
Metabolic syndrome (%)
 Cook et al.25) 4.6 (3.6–5.8) 3.6 (2.6–4.9)
 de Ferranti et al.26) 13.9 (12.0–16.1) 12.3 (10.5–14.4)
 IDF27) 1.4 (0.9–2.1) 1.8 (1.2–2.7)

Values are presented as mean (95% confidence interval).

BP, blood pressure; HDL, high density lipoprotein; IDF, International Diabetes Federation.

Table 3

Clinical characteristics of the participants with metabolic syndrome by gender

Variable Cook et al. (2003)25) de Ferranti et al. (2004)26) IDF (2007)27)
Male (n=81) Female (n=56) Male (n=244) Female (n=191) Male (n=24) Female (n=28)
Age (yr) 14.6 (14.1–15.1) 13.9 (13.2–14.7) 14.3 (14.0–14.7) 13.5 (13.2–13.9) 14.3 (13.4–15.2) 14.1 (13.1–15.2)
WC (cm) 87.6 (85.2–89.9) 82.3 (80.2–84.4) 84.6 (83.4–85.9) 76.5 (75.2–77.7) 95.7 (93.5–97.9) 85.7 (83.4–88.0)
BMI (kg/m2) 26.8 (25.9–27.6) 26.0 (24.9–27.0) 25.6 (25.1–26.0) 23.7 (23.2–24.2) 29.6 (28.6–30.5) 27.3 (26.0–28.6)
Systolic BP (mmHg) 116.1 (113.5–118.8) 108.0 (105.0–111.0) 113.4 (111.08–115.0) 107.7 (106.4–109.0) 117.4 (111.4–123.4) 109.5 (105.4–113.5)
Diastolic BP (mmHg) 74.8 (72.1–77.5) 68.9 (66.1–71.8) 71.1 (69.8–72.4) 68.9 (67.6–70.1) 72.9 (68.6–77.3) 68.4 (64.5–72.2)
Fasting glucose (mg/dL) 90.4 (88.9–91.8) 92.5 (89.8–95.3) 90.3 (89.4–91.1) 90.2 (89.0–91.2) 91.2 (87.4–95.0) 95.6 (91.2–99.9)
HDL-cholesterol (mg/dL) 37.7 (36.5–38.8) 38.2 (36.6–39.7) 39.8 (29.1–40.5) 41.8 (40.9–42.7) 38.0 (35.8–40.2) 37.2 (35.5–38.8)
Triglyceride (mg/dL) 184.9 (163.2–206.5) 192.8 (150.0–235.9) 160.8 (149.3–172.3) 149.9 (135.8–164.0) 219.8 (183.4–256.1) 178.3 (156.5–200.0)

Values are presented as mean (95% confidence interval).

WC, waist circumference; BMI, body mass index; BP, blood pressure; HDL, high density lipoprotein; IDF, International Diabetes Federation.

Table 4

The distribution of the HOMA-IR and the TyG index by gender

Variable Mean (95% CI) Percentile
10th 25th 50th 75th 90th
HOMA-IR
 Total 2.97 (2.90–3.04) 1.59 2.06 2.85 3.45 4.57
 Male 2.92 (2.83–3.00) 1.55 2.01 2.58 3.33 4.51
 Female 3.03 (2.93–3.13) 1.66 2.12 2.71 3.54 4.67
TyG index
 Total 8.13 (8.11–8.16) 7.51 7.78 8.11 8.44 8.79
 Male 8.11 (8.08–8.14) 7.48 7.74 8.08 8.44 8.80
 Female 8.15 (8.13–8.19) 7.55 7.84 8.14 8.45 8.78

HOMA-IR, homeostasis model assessment of insulin resistance; TyG, triglyceride glucose; CI, confidence interval.

Table 5

The proposed cutoff values of the HOMA-IR and TyG index for Korean children and adolescents according to 3 sets of criteria of metabolic syndrome

Variable Cook et al.25) de Ferranti et al.26) IDF27)
Cutoff point Sn (%) Sp (%) Cutoff point Sn (%) Sp (%) Cutoff point Sn (%) Sp (%)
HOMA-IR
 Total 3.29 73.3 72.1 2.96 71.1 64.7 3.54 80.8 77.7
 Male 2.98 76.5 66.2 2.86 71.5 64.2 3.54 79.2 79.3
 Female 3.49 75.9 75.4 2.96 74.9 61.3 3.69 82.1 79.1
TyG index
 Total 8.48 95.6 79.9 8.41 85.0 80.7 8.66 90.4 86.4
 Male 8.48 96.3 81.1 8.40 88.2 81.8 8.66 95.8 86.5
 Female 8.48 94.4 78.8 8.38 85.3 76.3 8.61 89.3 84.1

HOMA-IR, homeostatic assessment model of insulin resistance; TyG, triglyceride glucose; IDF, International Diabetes Federation; Sn, sensitivity; Sp, specificity.


ABOUT
ARTICLE CATEGORY

Browse all articles >

BROWSE ARTICLES
AUTHOR INFORMATION
Editorial Office
501-107, 30 Seocho-daero 74-gil, Seocho-gu, Seoul 06622, Republic of Korea
Tel: +82-2-3471-4268    Fax: +82-2-3471-4269    E-mail: editor@e-apem.org                

Copyright © 2024 by Korean Society of Pediatric Endocrinology.

Developed in M2PI

Close layer
prev next