


Highlights
High doses of MMI did not shorten the time required to normalize fT4, but resulted in the higher incidence of AEs. Low doses of MMI are suitable for mild GD, and high doses of MMI should be reconsidered for initial treatment in children and adolescents with GD.
Introduction
Graves' disease (GD) is an acquired autoimmune disease that causes diffuse toxic goiters, and it is the most common cause of hyperthyroidism in children and adolescents [1,2]. The 3 treatment options for pediatric GD are the same as those in adults: antithyroid drugs (ATDs), thyroidectomy, and radioactive iodine therapy. ATDs such as propylthiouracil (PTU), methimazole (MMI), and carbimazole (CBZ) are commonly used as initial GD treatments [3]. All those drugs are thioamide derivatives, and MMI is the active metabolite of CBZ after absorption [4].
When ATDs are administered for the initial management of GD in children, PTU should be avoided because it carries a risk of severe liver failure [5,6]. PTU can cause severe and rapid hepatotoxicity that can require liver transplantation [7]. Therefore, MMI is recommended as the initial ATD therapy in children [8,9]. The appropriate initial dose of MMI for children has been inadequately investigated. In adults, the initial dose should be adapted to the severity of the hyperthyroidism. Patients with larger goiters and free thyroxine (fT4) levels 3 to 4 times the upper normal limit should be started on 30 mg of MMI daily. Patients with small goiters and lower fT4 concentrations can be started on 15 to 20 mg of MMI daily [10,11]. In children, the typical initial dose used to be 0.5 to 1.0 mg/kg/day [3]. However, the guidelines of the American Thyroid Association (ATA) and American Association of Clinical Endocrinologists (AACE) say that doses for children can range from 0.1 to 1.0 mg/kg/day, depending on the initial state of hyperthyroidism [8]. That initial range is wider than the one typically used in recent years, which tends to be between 0.2 and 0.5 mg/kg/day [12-14].
To date, most publications about medical therapy for GD have focused on the clinical course and adverse events (AEs) in children treated with PTU. Few reports have sought a definite initial dose or examined the clinical course when MMI is used as the initial treatment for children with GD. However, the AEs of MMI, though less dangerous than those of PTU, still require attention and consideration [15,16]. Therefore, we retrospectively evaluated the relationship between the initial MMI dose and the development of AEs and investigated the clinical course of GD treated with MMI.
Materials and methods
1. Subjects
This study was conducted at Chonnam National University Hospital (CNUH). We retrospectively reviewed the medical records of children and adolescents who were diagnosed with GD and initially treated with MMI between January 2003 and June 2018 to study the relationship between the initial MMI dose and AEs.
2. Method
Based on the ATA guidelines, GD was diagnosed if the following diagnostic criteria were met [8]: (1) presenting with symptoms of hyperthyroidism, such as tachycardia, excessive sweating, weight loss, or no weight gain; (2) elevated serum triiodothyronine/fT4 levels accompanied by decreased serum thyroid-stimulating hormone (TSH); and (3) positive thyrotropin-binding inhibitory immunoglobulin (TBII). The initial dose was determined by individual physicians based on each patient's clinical symptoms and signs. As the symptoms of hyperthyroidism became more severe, the goiter size reached higher grades in the World Health Organization classification, and the grade of exophthalmos in the ATA classification (based on Werner's NOSPECS classification) increased, higher doses were prescribed. We defined AEs as follows: neutropenia (neutrophil count <1,000/mm3), agranulocytosis (granulocyte count <250/mm3), and liver dysfunction (aspartate aminotransferase [AST] or alanine aminotransferase [ALT] > 60 IU/L) [17]. After the start of MMI treatment, AEs were assessed at least once every 2–4 weeks until the serum fT4 levels fell to within the normal range. During maintenance treatment, after the normalization of serum fT4 levels, laboratory evaluations were conducted more than 3 times a year. MMI treatment was withdrawn if thyroid function was maintained within the normal range during 18–24 months of maintenance treatment or if the level of TBII descended as a negative finding [14]. After the completion of MMI treatment, a thyroid function test was performed more than twice a year for at least 2 years to check for relapses. The outcomes were evaluated more than 2 years after the initiation of MMI treatment. We enrolled 99 patients in this study and divided the subjects into 3 groups according to their initial dose of MMI: < 0.4 mg/kg/day (group A; n=32); 0.4–0.7 mg/kg/day (group B; n=39); and > 0.7 mg/kg/day (group C; n=28). We analyzed baseline characteristics, such as age, sex, family history of thyroid disease, and AEs, through a retrospective analysis of medical records. In addition, we evaluated serum levels of fT4, TSH, complete blood count, AST, ALT, anti-thyroid peroxidase antibody (anti-TPO), antithyroglobulin antibody (ATA), and TBII. FT4 (normal range, 0.89–1.76 ng/dL; measurable range up to 12.0 ng/dL) and TSH (normal range, 0.64–6.27 mIU/L) were measured using a chemiluminescence immunoassay technique (ADVIA Centaur, Siemens, Germany). Anti-TPO (normal range, 0–34 IU/mL) and ATA (normal range, 0–115 IU/mL) were analyzed using an electrochemiluminescence immunoassay kit (COBAS, Roche Diagnostics GmbH, Mannheim, Germany). TBII values were presented as percentages from 2003 to 2013 (normal range, 0%–15%) using a radioimmunoassay (RSR Ltd., Cardiff, UK) and then presented as IU/L (normal range, 0–1.5 IU/L) using a different radioimmunoassay (Shinjin Medic Inc., Goyang, Korea), so it is segregated into 2 categories.
3. Statistical analysis
Data are expressed as the mean±standard deviation or proportion (%) depending on the characteristics of the variables. A 1-way analysis of variance was used to compare the means of continuous variables (age, sex ratio, MMI dose, fT4, TSH, TBII, anti-TPO, ATA, time required for normalization of fT4), and post hoc Tukey tests were used to compare group differences. We used the Pearson chi-square test to compare the proportions of categorical variables (incidence of AEs) among different patient subgroups. All statistical analyses were performed using IBM SPSS Statistics ver. 21.0 (IBM Co., Armonk, NY, USA). P-values <0.05 were considered statistically significant.
Results
1. Comparison of MMI efficacy based on the initial dose
We enrolled 99 patients (22 males and 77 females) and divided them into 3 groups: A (n=32), B (n=39), and C (n=28). The mean age, sex ratio, mean MMI dose, serum fT4 and TSH concentrations, TBII, anti-TPO, and ATA at diagnosis are shown in Table 1. The fT4 level at diagnosis was 2.40 ng/dL in group A, 4.30 ng/dL in group B, and 4.69 ng/dL in group C. The fT4 level was significantly higher in group C, indicating that patients who presented with greater disease severity were started on higher MMI doses (P=0.001). However, when comparing only groups B and C, the fT4 and TSH levels did not differ significantly (fT4, P=0.710; TSH, P=1.000). The levels of TBII, anti-TPO, and ATA did not differ significantly among the groups.
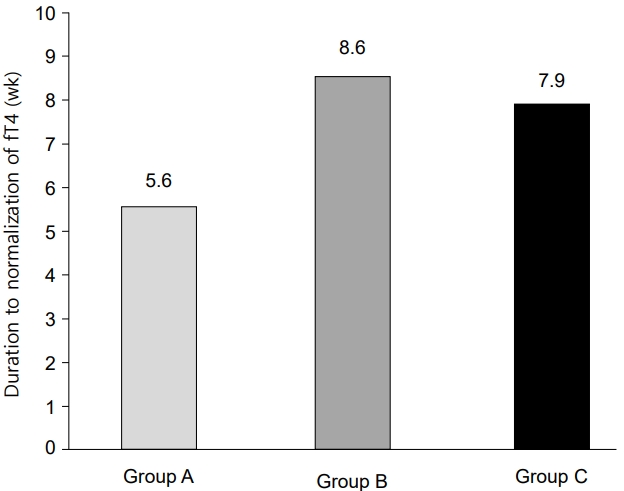
The time required to normalize serum fT4 levels after the initial treatment was used to assess the efficacy of MMI. The mean duration was 5.6±4.2, 8.6±10.4, and 7.9±8.2 weeks in groups A, B, and C, respectively (Fig. 1). No significant differences were found among the 3 groups (P=0.116), and no statistical differences were found when comparing only groups B and C, either. Therefore, higher doses did not shorten the time required to normalize fT4.
2. Comparison of the AE incidence and clinical course
During the observation period, no serious AEs, such as agranulocytosis or severe liver failure, were observed. The proportion of patients with AEs was higher in group C than in the other groups (12.5%, 20.5%, and 42.9% in groups A, B, and C, respectively, P=0.018) (Table 2). The incidence of liver dysfunction was significantly higher in group C than in the other groups (9.4%, 7.7%, and 28.6% in groups A, B, and C, respectively, P=0.034). Neutropenia was not observed in group A, but it occurred in 7.7% of the patients in group B and 21.4% of those in group C (P=0.015). The incidence of skin rash was also higher in the groups with higher MMI doses (3.1%, 5.1%, and 10.7% in groups A, B, and C, respectively), but those differences were not significant (Table 2). When comparing only groups B and C, the incidence of liver dysfunction and neutropenia was significantly higher in group C (P=0.04 and P=0.021, respectively).
Patients with clinical conditions such as viral infections and those requiring other medical treatments that could be confused with the development of AEs due to MMI were excluded from this statistical analysis. If mild AEs, such as a skin rash resolved by antihistamines or liver dysfunction, occurred, the clinical course was observed without reducing the MMI dose. If the AEs continued or proved burdensome for the patient, the MMI dose was reduced. The onset of severe hepatitis (AST or ALT elevation more than 3 times the upper normal limit) or agranulocytosis requires the termination of MMI treatment. Overall, when AEs appeared, the initial MMI dose was maintained in 66.7% of cases and reduced in 33.3% of cases. The rate of dose reduction due to AEs was 50.0% in group B and 33.3% in group C. No patients in group A received an MMI dose reduction. When neutropenia occurred, the dose of MMI was reduced, and neutrophil counts were monitored closely.
The time from the start of MMI therapy to the appearance of AEs was 1.68, 2.03, and 0.75 months for liver dysfunction, neutropenia, and skin rash, respectively. Those times did not differ significantly among the groups. The clinical courses of patients >2 years after the initiation of MMI are shown in Table 3. The patients whose observation period was less than 2 years and those who were transferred to another hospital or lost to follow-up were excluded from this statistical analysis. The average observation period was 40.5 months. The overall remission rate was 34.7%, and the remission rates did not differ significantly among the groups (37.5%, 31.0%, and 36.8% in groups A, B, and C, respectively). The overall percentage of patients who failed to withdraw from MMI therapy was 30.6% (29.1%, 37.9%, and 21.1% in groups A, B, and C, respectively). The overall rate of relapse after MMI treatment was withdrawn was 31.9% (29.1%, 27.6%, and 42.1% in groups A, B, and C, respectively). The average period to relapse after MMI withdrawal was 4.6 months.
Discussion
ATDs have been used to treat GD for 6 decades [4]. MMI is prioritized over PTU as an initial treatment for GD for 2 reasons. The first is that compliance with MMI treatment is high among children and adolescents because of its once-a-day dosage [8]. MMI has a longer half-life than PTU and is effective when given as a single daily dose [18]. The second reason is the reduced risk of major AEs, compared with those of PTU. PTU can cause fulminant hepatic necrosis, which can be fatal, and liver transplantation has been necessary in a few patients taking PTU [19]. Although liver dysfunction has also appeared in patients taking MMI, as in our study, the hepatotoxicity associated with MMI treatment is typically cholestatic, and hepatocellular disease is rarely seen [20]. Therefore, MMI should be used as the first-line drug in patients diagnosed with GD. However, few studies have assessed the relationship between the initial MMI dose and AEs.
ATD treatment can use the titration or block and replace method [21,22]. The block and replace method is not commonly used because it requires higher doses and has thus been shown to result in a higher rate of side effects [8]. The ATA and AACE guidelines recommend the titration method [8]. However, those guidelines offer wide ranges, which differ slightly from each other, for the initial ATD dose: 10–20 mg daily for adults and 0.1–1.0 mg/kg/day in children. In Japan, Minamitani et al. [14] recommended starting doses of 0.25–1.0 mg/kg/day in children, which is lower than the dose generally used in Japan (0.5–1.0 mg/kg/day) [23]. There is no definitive guideline for the initial MMI dose for childhood-onset GD in Korea. Since the recent designation of AE reduction as the highest priority, ATD doses have tended to decrease [14]. In our study, based on 15 years of data, we divided the range from 0.1 to 1.0 mg/kg/day into 3 sections to study the relationship between the initial MMI dose and the clinical course after treatment.
The initial MMI dose is determined by the severity of GD, but few studies to date have focused on children. The severity of GD is assessed using fT4 and TSH levels, with higher fT4 levels and lower TSH levels indicating higher GD severity [24]. In adults, Nakamura et al. [11] reported that 15 mg/day of MMI was appropriate for mild and moderate GD (fT4 level less than 7 ng/dL) because it offered similar effectiveness and a lower frequency of adverse reactions compared with 30 mg/day, whereas 30 mg/day of MMI was appropriate for severe GD (fT4 level more than 7 ng/dL). Shiroozu et al. [25] also reported that greater efficacy from higher MMI doses was clear in severe GD, but in mild GD, 30 mg/day of MMI was no more effective than 15 mg/day. In children, previous studies have produced contrasting results. Slyper et al. [26] reported that an initial MMI dose >0.5 mg/kg was more effective for children and adolescents with GD than doses <0.5 mg/kg, without considering GD severity. Matsushita et al. [23] reported that the mean time to the normalization of fT4 levels did not differ significantly between groups using a high (≥0.7 mg/kg/day) and low (<0.7 mg/kg/day) dose of MMI, and their groups did not differ significantly in GD severity.
In our study, the severity of GD was significantly higher in the moderate-dose (group B) and high-dose (group C) groups than in the low-dose group (group A). In the low-dose group, because the severity of GD was low, the time to euthyroid was shorter than that in the other groups, despite using a lower dose. Therefore, for mild GD, a low dose (<0.4 mg/kg/day) of MMI is appropriate. Although the difference was not statistically significant, the remission rate in the low-dose group was also slightly higher because that group included many cases of mild GD. When we compared the 3 groups in our study, they did not differ significantly in the time required to reach a euthyroid state after MMI initiation. In addition, long-term outcomes, such as the remission and relapse rates, did not differ significantly among the groups.
Several reports have indicated that MMI-induced AEs depend on the MMI dose [18]. In adults, the frequency of AEs can be dose-related, and the rate of severe AEs is very low in patients receiving MMI doses <10 mg/day [4]. In another study in adults, MMI-induced neutropenia was significantly higher in patients receiving 30 mg/day than in those receiving 15 mg/day [27]. These results are similar to the outcomes of our study in children. In our data, the frequency of MMI-induced AEs was significantly higher in the high-dose group (42.9%) than in the low- (12.5%) and moderate-dose (20.5%) groups, suggesting that the AEs were dose-dependent. A higher dose of MMI resulted in a higher frequency of major AEs, such as liver dysfunction and neutropenia. Neutropenia occurred in 7.7% of the moderate-dose group and 21.4% in the high-dose group, and it did not occur at all in the low-dose group. Sato et al. [17] reported that when 64 MMI-treated children were divided into 3 groups by dose, the frequency of AEs in the high-dose group was extremely high (63%), consistent with our results.
When we compared only the moderate- and high-dose groups, we found no difference in the remission rate between the 2 groups. But the incidence of AEs was significantly higher in the high-dose group. Therefore, the use of high MMI doses (>0.7 mg/kg/day) as an initial therapy should be avoided in children and adolescents with GD. We find that low MMI doses are suitable for children with mild GD, and moderate doses of MMI are appropriate for children with severe GD. In addition, to ensure patient understanding, we recommend that patients be informed both verbally and in writing about MMI-associated AEs.
In our study, the time from the start of MMI therapy to the appearance of AEs was approximately 1.5 months. Skin rash appeared in 0.8 months, which tended to be sooner than other AEs, and neutropenia appeared in 2.0 months, which was longer than it took other AEs to develop. AEs developed within 3 months of treatment initiation in 79.2% of AE cases. Ohye et al. [28] reported that most AEs (91.6%) occurred within the first 3 months of ATD treatment. Therefore, routine monitoring and short-term follow-up should be performed during that period. Agranulocytosis, which is a serious AE, was not observed in our study, but neutropenia was observed in 9.1% of cases. Yasuda et al. [29] reported that neutropenia was the most common AE to occur after 1 year, and it tended to appear later than other AEs. Therefore, monitoring for the development of neutropenia should be continued throughout MMI therapy.
We recognize that the limitations of our study are its retrospective nature, the small number of patients, and the nonrandom allocation of patients to the MMI dose-based groups. A long-term, double-blind, prospective trial with well-matched patient groups should be conducted to confirm our findings.
In conclusion, we reviewed the medical records of children and adolescents with GD to investigate the efficacy of MMI according to the initial dose and examine the relationship between the initial MMI dose and the development of AEs. Low MMI doses are suitable for treating mild GD, and moderate doses of MMI are advisable for severe GD. High MMI doses (>0.7 mg/kg/day) should be reconsidered as an initial treatment in children and adolescents with GD. Most AEs were observed within 3 months of MMI treatment initiation, so close monitoring of AEs is required during that period.