


Highlights
This study investigated the prevalence of fasting hyperglycemia in Korean teenagers aged 10ŌĆō18 years and its association with metabolic indicators.
Introduction
In children, adolescents, and adults, obesity causes not only excessive fat accumulation in the human body, but also dyslipidemia and hypertension. In addition, obesity increases insulin resistance over time, causing glucose intolerance and metabolic disorders such as type 2 diabetes mellitus (T2DM) [1].
In many cases of T2DM, glucose intolerance appears early in the course of the disease and gradually progresses thereafter. Thus, glucose intolerance is a prognostic factor for diabetes [2] and cardiovascular disease [3]. Insulin resistance is the main cause of cardiovascular diseases. Insulin has a complex effect on blood vessels. When insulin is present in the blood in normal concentration, the vasoprotective action is dominant; however, in the insulin-resistant state, the nitrate oxide (NO) pathway activated by insulin is damaged, and the mitogen-activated protein kinase (MAPK) pathway becomes predominant, resulting in blood vessel constriction and inflammatory reactions, which increase blood pressure and cause inflammation [4]. Lifestyle corrections can prevent or delay the progression of glucose intolerance to diabetes.
The rates of obesity in children and adolescents have nearly doubled worldwide in recent decades [5], and several studies have reported that the prevalence of T2DM has recently increased in children and adolescents, especially those with obesity. An increasing trend of metabolic abnormalities, such as T2DM, obesity, dyslipidemia, and hypertension, in children and adolescents has been reported in the United States, Europe, and Japan [6].
In England, Sinha et al. [7] conducted oral glucose tolerance tests on adolescents and children, and the results showed that impaired glucose tolerance is highly prevalent among children and adolescents with severe obesity.
In the United States, Li et al. [8] analyzed the relationship between glucose intolerance and metabolic risk factors in adolescents aged 12ŌĆō19 years using data from the National Health and Nutrition Examination Survey. Prediabetes was highly prevalent among adolescents with obesity and demonstrated increased metabolic risk in this population.
In Korea, there have been some studies on the association between obesity and T2DM in children and adolescents; however, no studies have evaluated the prevalence of fasting hyperglycemia and the relationships between fasting hyperglycemia and metabolic indicators [9,10].
In this study, to assess the risk of diabetes in domestic children and adolescents, the prevalence of fasting hyperglycemia was calculated, and the trend was evaluated using multi-year data. To verify this, we planned to evaluate diabetes risk based on fasting blood sugar level in Korean teenagers using Korea National Health and Nutrition Examination Survey (KNHANES) data from the past decade. Body mass index (BMI), blood pressure, and cholesterol and triglyceride levels were measured to assess the relationships between fasting hyperglycemia and metabolic indicators based on the KNHANES data.
Materials and methods
1. Data sources and study subjects
To assess trends in the prevalence of impaired fasting glucose (IFG) and diabetes mellitus defined as fasting blood glucose (DMFBG) in Korean teenagers, we used national survey data from the fourth (2007ŌĆō2009), fifth (2010ŌĆō2012), sixth (2013ŌĆō2015), and seventh (2016ŌĆō2018) surveys of the KNHANES. The KNHANES commenced in 1998, and has been conducted annually since 2007, to collect data on the health status and nutritional intake of the Korean population. Thus, the KNHANES targets noninstitutionalized Korean citizens residing in Korea, and sampling follows a multistage clustered probability design involving health interviews, health examinations, and nutrition surveys. A detailed description of the KNHANES has been published elsewhere [11]. Serological tests were conducted on subjects aged 10 years or older. Thus, in this study, children aged 10ŌĆō18 years with fasting blood glucose data, where fasting lasted at least 8 hours, were included in the study. However, subjects diagnosed with DM by a clinician were excluded from this study. Thus, the numbers of eligible study subjects were 2,521, 2,322, 1,787, and 1,816 in the fourth, fifth, sixth, and seventh surveys, respectively. Written consent was obtained from the participants, and all data were anonymized. Ethical approval for use of open KNHANES data was waived by the Institutional Review Board Committee of Ewha Womans University Hospital (IRB no. 2021-01-015).
2. Measurements
Fasting blood glucose was measured by the hexokinase ultraviolet method using a Hitachi Automatic Analyzer 7600-210 (Hitachi, Tokyo, Japan). A fasting blood glucose level between 100 and 125 mg/dL in teenagers was considered IFG, and a fasting blood glucose level Ōēź 126 mg/dL was considered DMFBG. Using the measured weight and height data, BMI was calculated as weight in kilograms divided by height in meters squared (kg/m2). BMI was classified into the 3 grades of normal (<85th percentile), overweight (85thŌĆō94th percentile), and obesity (Ōēź95th percentile). Overweight and obesity were defined based on the 2017 Korean Children and Adolescent National Growth Charts [12]. Blood pressure was measured 3 times, and the average of the second and third measurements was used. Total cholesterol, triglycerides, and high-density lipoprotein cholesterol (HDL-c) were used as lipid-related metabolic components. Total cholesterol and triglyceride levels were measured by the enzymatic method and HDL-c by the homogeneous enzymatic colorimetric method using the Hitachi Automatic Analyzer 7600-210 (Hitachi, Tokyo, Japan).
3. Covariates
Regarding demographic data, sex, age, and quartile of household income were considered. In the questionnaire, if either of the parents answered "yes" to DM history, the subject was considered as having a parental history of DM. Data on parental history of DM have been collected since the fifth survey. Regarding the nutritional intake of macronutrients, including total energy intake, we used data from 24-hour recall surveys. The 2015 Dietary Reference Intakes for Koreans recommend that teenagers consume 55%ŌĆō65% of their total energy intake from carbohydrates and 15%ŌĆō30% from fat. Thus, subjects who exceeded the recommended intake were grouped and evaluated. Excess caloric intake was defined based on the 2015 Dietary Reference Intakes for Koreans [13].
4. Statistical analysis
In summary statistics, considering the sampling method, unweighted frequencies with weighted percentages were presented for categorical variables and weighted means with 95% confidence intervals for numerical variables.
Considering the 2010 census population as the standard population [14], the age-adjusted prevalence with standard error (SE) was calculated according to the direct standardization method from 10 to 18 years of age in 1-year units. The age-adjusted prevalence of IFG and DMFBG was expressed per 100 persons and estimated according to sex and obesity status (normal/overweight and obesity). The trend test for age-adjusted prevalence was performed using a survey-weighted linear regression model with survey cycle as a continuous independent variable.
To assess the relationships between high blood glucose level and metabolic components, we analyzed data from 2013 to 2018. Candidate covariates were selected through univariate analysis, and covariates with P<0.05 in univariate analysis were considered in multivariate analysis. Thus, statistical significance was obtained using the PROC SURVEYREG procedure for numerical variables and the PROC SURVEYFREQ procedure for categorical variables. The mean difference in metabolic components by blood glucose level was assessed after adjusting for the selected covariates. All statistical analyses were conducted using SAS ver. 9.4 (SAS Institute, Cary, NC, USA). Statistical significance was set at P<0.05 according to a 2-tailed test.
Results
1. Demographics of study subjects
Table 1 displays the characteristics of the study subjects from 2007 to 2018. Among Korean youths aged 10ŌĆō18 years, the parental history of DM from 2010 to 2018 increased from 5.41% to 7.53% (P=0.189 for trend). From the perspective of nutritional factors, the percentage of energy derived from fat from 2007 to 2018 increased from 21.56% to 24.04% (P<0.001 for trend). In addition, fat intake accounting for more than 30% of total energy from 2007 to 2018 increased from 13.92% to 22.08% (P<0.001 for trend); however, carbohydrate intake accounting for over 65% of total energy from 2007 to 2018 declined from 48.98% to 33.89% (P<0.001 for trend). In terms of metabolism-related factors, the obesity statuses in 2013ŌĆō2015 (14.56%) and 2016ŌĆō2018 (14.43%) were higher than those in 2007ŌĆō2009 (12.08%) and 2010ŌĆō2012 (12.44%). Systolic blood pressure from 2007 to 2018 increased from 105.49 mmHg to 108.36 mmHg. Total cholesterol from 2007 to 2018 increased from 158.00 mg/ dL to 164.72 mg/dL (P<0.001 for trend). Fasting blood glucose values for 2013ŌĆō2015 (91.52 mg/dL) and 2016ŌĆō2018 (91.46 mg/dL) were both higher than those for 2007ŌĆō2009 (88.93 mg/ dL) and 2010ŌĆō2012 (88.72 mg/dL) (P<0.001 for trend). Fig. 1 shows the distribution of fasting blood glucose values, which, from 2013ŌĆō2018, shifted to the right compared to those in 2007ŌĆō2012.
2. Trends in age-adjusted prevalence of IFG and DMFBG
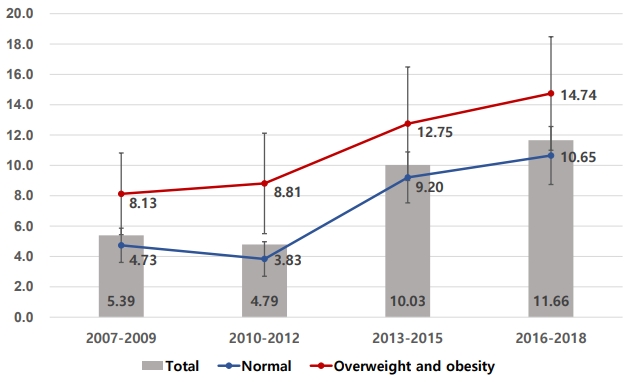
From 2007 to 2018, the prevalence of IFG and DMFBG significantly increased from 5.39 per 100 persons (SE, 0.56) to 11.66 per 100 persons (SE, 0.91) (P<0.001 for trend). The prevalence of DMFBG alone was very low, less than 0.5 per 100 persons. This trend for the prevalence of IFG or DMFBG was similar in the overweight and obesity groups (BMIŌēź85th percentile) and the normal weight group (BMI<85th percentile). However, the increase in boys (from 5.92 per 100 persons to 15.00 per 100 persons, P<0.001 for trend) tended to be higher than that in girls (from 4.75 per 100 persons to 7.94 per 100 persons, P=0.002 for trend) (Table 2).
3. Differences in candidate risk factors according to fasting blood glucose level
Using data from 2013 to 2018, comparing the basic risk factors between the normal group and the IFG+DMFBG group according to fasting blood glucose level, significant differences were observed with respect to sex, age, parental history of DM, and obesity status (Table 3). In terms of sex, the percentages of boys and girls were 66.58% and 33.42% in the IFG+DMFBG group (P<0.001), respectively. The mean age of the IFG+ DMFBG group was 13.75 years and that of the normal group was 14.46 years (P<0.001). Parental history of DM was higher in the IFG+DMFBG group (12.74%) than that in the normal group (6.20%) (P<0.001). However, there were no significant differences in household income, total energy intake, or nutritional intake of macronutrients. Overweight and obesity were more prevalent in the IFG+DMFBG group than in the normal group (Table 3).
4. Differences in metabolic components according to fasting blood glucose level
In the multivariate model, metabolic components, except BMI, were adjusted for sex, age, obesity status, and parental history of DM, whereas BMI was adjusted for sex, age, and parental history of DM (Table 4). Within the multivariate model, there were significant differences in BMI between the normal group (21.22 kg/m2; 95% confidence interval [CI], 20.93ŌĆō21.51) and the IFG+DMFBG group (22.06 kg/m2; 95% CI, 21.60ŌĆō22.52) (P<0.001). In addition, there was a significant difference observed in systolic blood pressure between the normal group (109.83 mmHg; 95% CI, 108.80ŌĆō110.86) and the IFG+DMFBG group (112.64 mmHg; 95% CI, 111.03ŌĆō114.25) (P<0.001). There was also a significant difference in triglycerides between the normal group (81.59 mg/dL; 95% CI, 78.05ŌĆō85.28) and the IFG +DMFBG group (89.60 mg/dL; 95% CI, 83.26ŌĆō96.42) (P=0.007). The mean HDL-c according to fasting blood glucose level was significantly different in the univariate model but not in the multivariate model.
Discussion
This study revealed an increasing trend in the prevalence of fasting hyperglycemia, including IFG and DMFBG, in Korean teenagers from 2007 to 2018. The prevalence of IFG and DMFBG in Korean teenagers increased significantly from 4.76% in the fourth KNHANES (2007ŌĆō2009) to 11.36% in the seventh KNHANES (2016ŌĆō2018).
The prevalence of IFG and DMFBG increased from 4.79% in the fifth KNHANES (2010ŌĆō2012) to 10.03% in the sixth KNHANES (2013ŌĆō2015). We confirmed that there were no changes in the blood glucose measurement equipment or reagents at that time. In addition, it was confirmed that the scale calculated by prevalence in this study was similar to that of the internal KNHANES data. Therefore, it was difficult to clearly determine whether a change in the period was actually a change or whether a systematic error was involved.
The increasing prevalence of fasting hyperglycemia is consistent with that of recent decades, showing an increasing prevalence of fasting hyperglycemia among children and adolescents in industrialized countries, such as the United States and the United Kingdom [7,8]. Several studies conducted in the United States reported that the prevalence of pediatric diabetes patients was less than 4% before the 1990s but had increased up to 45% in recent studies. This trend is not limited to the United States. In a study on the prevalence of type 2 diabetes in middle and high school students in Tokyo, a urine glucose screening test was performed, and a glucose tolerance test was performed as a confirmatory test. Our results show that the diabetes prevalence rate from 1976 to 1980 was 7.3/10,000 people, increasing to 13.9/10,000 from 1991 to 1995 [15].
According to a survey by Li et al. [8], the prevalence of IFG, impaired glucose intolerance, and prediabetes was 13.1%, 3.4%, and 16.1%, respectively, in adolescents aged 12ŌĆō19 years in the United States. Prediabetes was defined as IFG (fasting glucose > 100 mg/dL and <125 mg/dL) and/or impaired glucose intolerance (2 hours after oral glucose tolerance test, glucose > 140 mg/dL and < 200 mg/dL). Metabolic risk factors were classified into 4 factors: central obesity, blood pressure, triglycerides, and HDL cholesterol. The results showed that metabolic risk factors were significantly associated with prediabetes but not with body weight.
The causes of impaired glucose tolerance impacted by obesity include hyperinsulinemia and insulin resistance [16]. As adipocytes proliferate in individuals with obesity, serum levels of hormones, nonesterified fatty acids, glycerol, and leptin secreted by adipose tissue, as well as C-reactive protein, tumor necrosis factor-╬▒, angiotensinogen, fibrinogen, interleukin, cortisol, and plasminogen activator inhibitor-1 increase. Adiponectin concentration decreases, resulting in a decreased sensitivity of cells to insulin. As the insulin responsiveness of the cells decreases, the serum concentration of insulin becomes consistently high; that is, hyperinsulinemia is induced and, as hyperinsulinemia continues, dysfunction of pancreatic islet ╬▓-cells that secrete insulin is accompanied by progression to T2DM [17-19].
The fasting hyperglycemia group showed an increase in metabolic indicators of blood pressure, triglycerides, and cholesterol levels compared to the normal fasting blood glucose group. The causes of hypertension and metabolic abnormalities involving glucose intolerance are the result of insulin resistance. Insulin is an anabolic hormone that plays an important role in the storage of sugar, fat, and energy and contributes to sodium homeostasis by promoting sodium reabsorption in the kidneys, as well as having metabolic effects. In obesity, hyperinsulinemia occurs as a result of insulin resistance, activating sympathetic nerves, increasing sodium reabsorption in the kidneys, and increasing blood pressure [20].
Insulin has a complex effect on the blood vessels. It stimulates the production of NO in endothelial cells, induces vasodilation and anti-inflammatory reactions to protect blood vessels, and concurrently promotes the MAPK pathway, leading to vasoconstriction and inflammation. The blood vessel-destructive action that triggers the reaction occurs simultaneously. When insulin blood concentration is normal, the vasoprotective action is dominant; however, in the insulin-resistant state, the NO pathway activated by insulin is disrupted, and the MAPK pathway becomes predominant, resulting in blood vessel constriction and inflammatory reactions, which increase blood pressure and cause inflammation [21-24].
We demonstrated that the increasing rate of fasting hyperglycemia was higher in boys than in girls. The posited reason for this was the difference in insulin resistance due to gender differences between growth and sex hormones. During puberty, growth hormone and insulin-like growth factor (IGF)-1 increase rapidly and subsequently decrease after puberty is complete. Growth hormone and IGF-1 affect insulin resistance during normal pubertal development. On average, girls start puberty at 10ŌĆō11 years of age and end at 15ŌĆō17 years. Boys start puberty at 11ŌĆō12 years of age and end at 16ŌĆō17 years. This study targeted children and adolescents between the ages of 10 and 18 and suggests that boys have higher fasting blood glucose level than girls because the proportion of boys undergoing puberty with increased insulin resistance is relatively higher than that of girls [25].
According to our results, during the 2013ŌĆō2018 period, the average age of the normal blood glucose group was 14.46 years, whereas that of the diabetes high-risk group was 13.75 years. Fasting blood glucose level was significantly higher in the younger patients. The incidence of T2DM is more higher during puberty, when explosive increases in growth and sex hormones occur. This increase in growth hormone secretion causes a temporary period of insulin resistance [26]. In our study, in participants aged 16ŌĆō18 years, it was estimated that the effects of growth and sex hormones had decreased, and blood glucose had declined.
As shown in Fig. 1, fasting blood glucose level was higher in the overweight and obesity groups (Ōēź85th percentile or BMI Ōēź 25.0 kg/m2) than in the normal weight group. However, as in the overweight and obesity groups, fasting blood glucose had increased in the last decade in a similar pattern in the normal weight group.
Parent diabetes history was significantly higher in the diabetes high-risk group (12.74%) than in the normal blood glucose group (6.20%), and there was no significant difference in total household income, total energy intake, or intake of macronutrients. It is well known that a family history of T2DM is a risk factor for diabetes. However, it is controversial whether environmental or genetic factors are the main risk factors. Many studies have shown that environmental factors, such as physical activity and BMI, together with familial characteristics and genetic factors, exert a combined, simultaneous effect on diabetes risk [27].
In terms of nutritional composition, the total energy intake, excess calorie intake, and fat and carbohydrate intake were not significantly different between the normal blood glucose and hyperglycemia groups. The results of one diabetes study in domestic adults showed that the diabetes group had a higher percentage of energy intake from carbohydrates than the normal blood glucose group [25]. Given that carbohydrates are broken down into monosaccharides in the blood, it is easy to deduce that the higher is the intake of carbohydrates, especially carbohydrates with a high glycemic index, the higher will be the blood sugar level after a meal [26]. However, in this study, there was no difference between carbohydrates or other macronutrients in the nutritional compositions of the normal and hyperglycemic groups.
Since this study was based on KNHANES data, nutritional details such as glycemic index were not considered, and environmental factors such as exercise habits were not investigated. Therefore, it is difficult to determine the cause of the recent increase in blood sugar level. This is a limitation of this study, and further research is required. Another weakness is that serum insulin was not directly measured or directly inferred from serum glucose status, although the main pathogenesis of diabetes is hyperinsulinemia. The strength of this study is that it evaluated trends using multi-year data at the national level, and the reliability of the data is high because it was collected from more than 5,000 people over a long period of time, about 10 years.
In conclusion, the proportion of fasting hyperglycemia among adolescents has increased over the past decade and is believed to be associated with an increase in metabolic abnormalities such as hypertension and hypertriglyceridemia. A more detailed study is necessary to evaluate the effects of environmental factors and eating habits; nevertheless, obesity, as per consensus, increases the risk of metabolic syndromes such as diabetes, hypertension, and dyslipidemia. Prevention of the progression of prediabetes in adolescents to diabetes in adulthood has recently become an urgent issue in Korea.